home
projects
blog
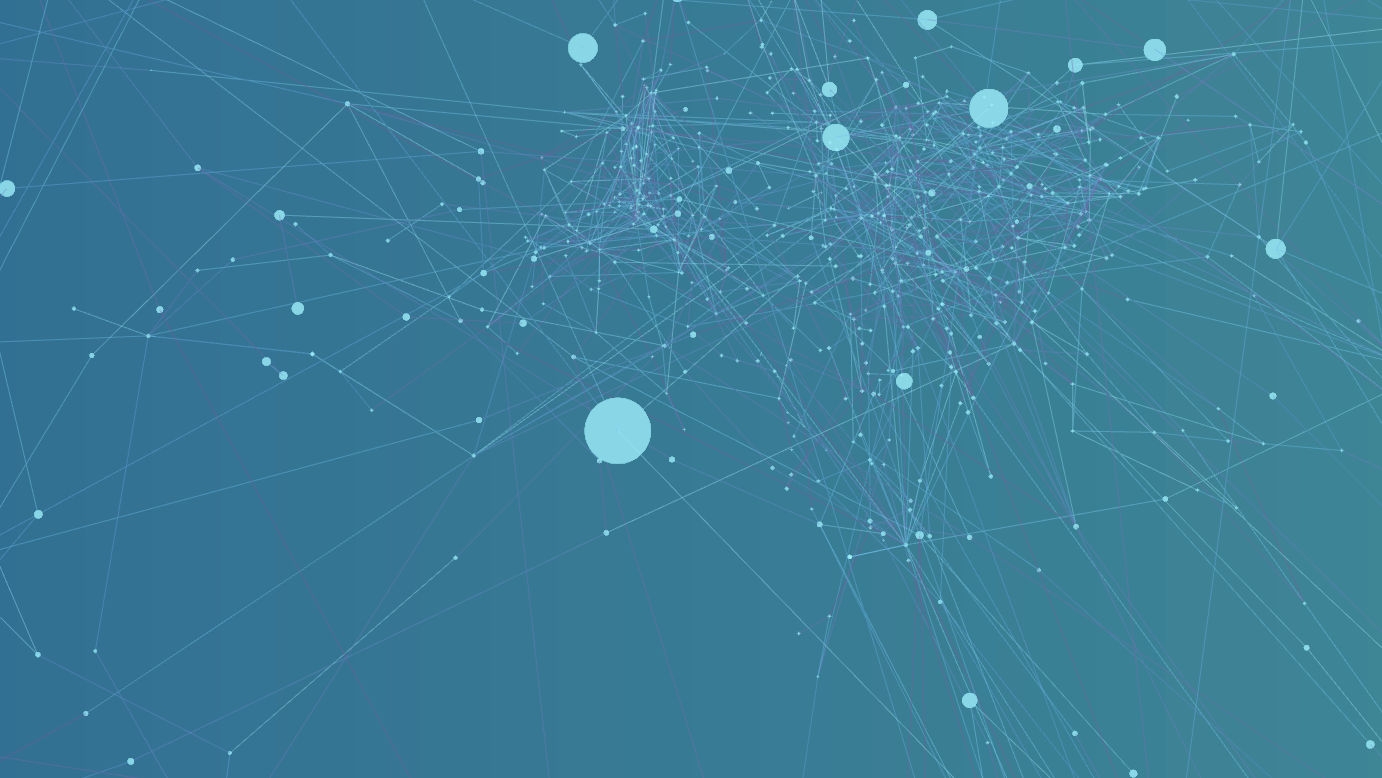
Network Simulation
Visualizing Community Networks From Facebook Data
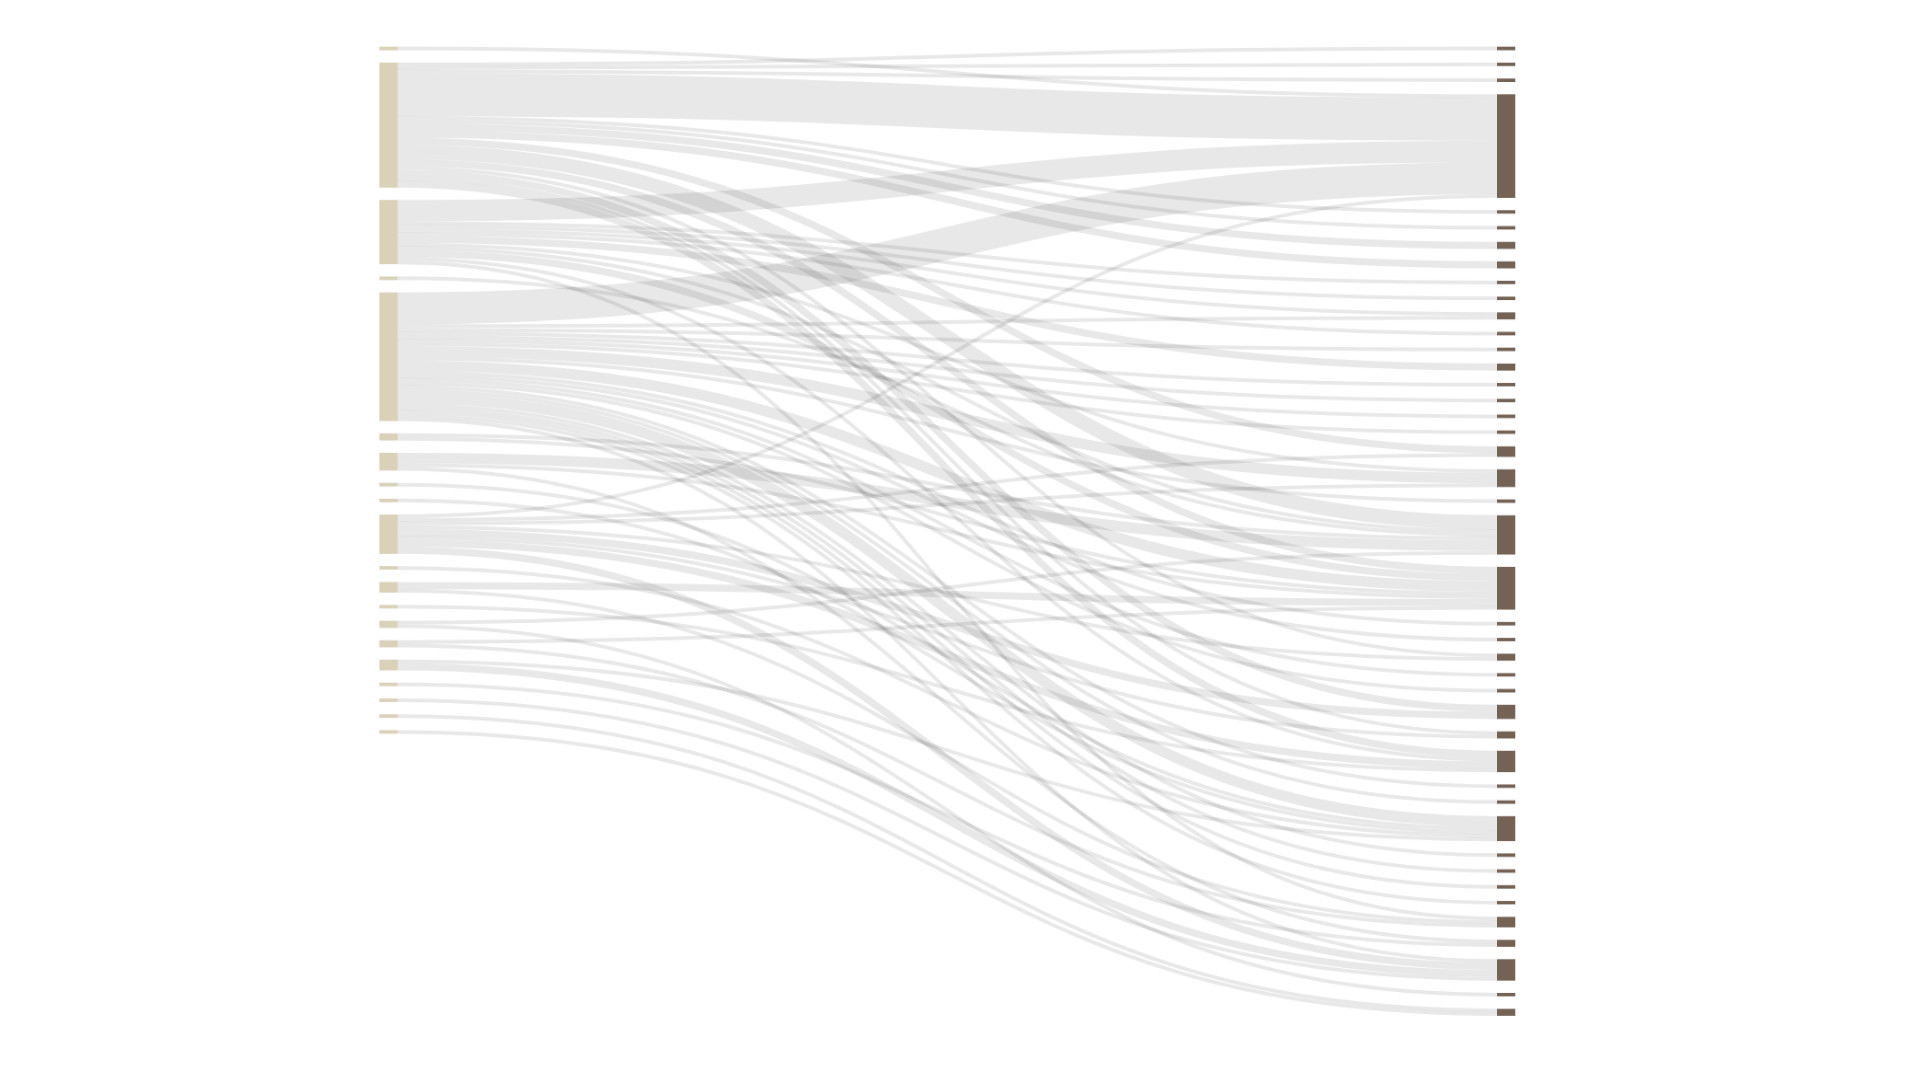
Anglophone LGBT Writers
Networks of Anglophone LGBTQ+ Exile Writers
Visiting Card
My Digital Resume
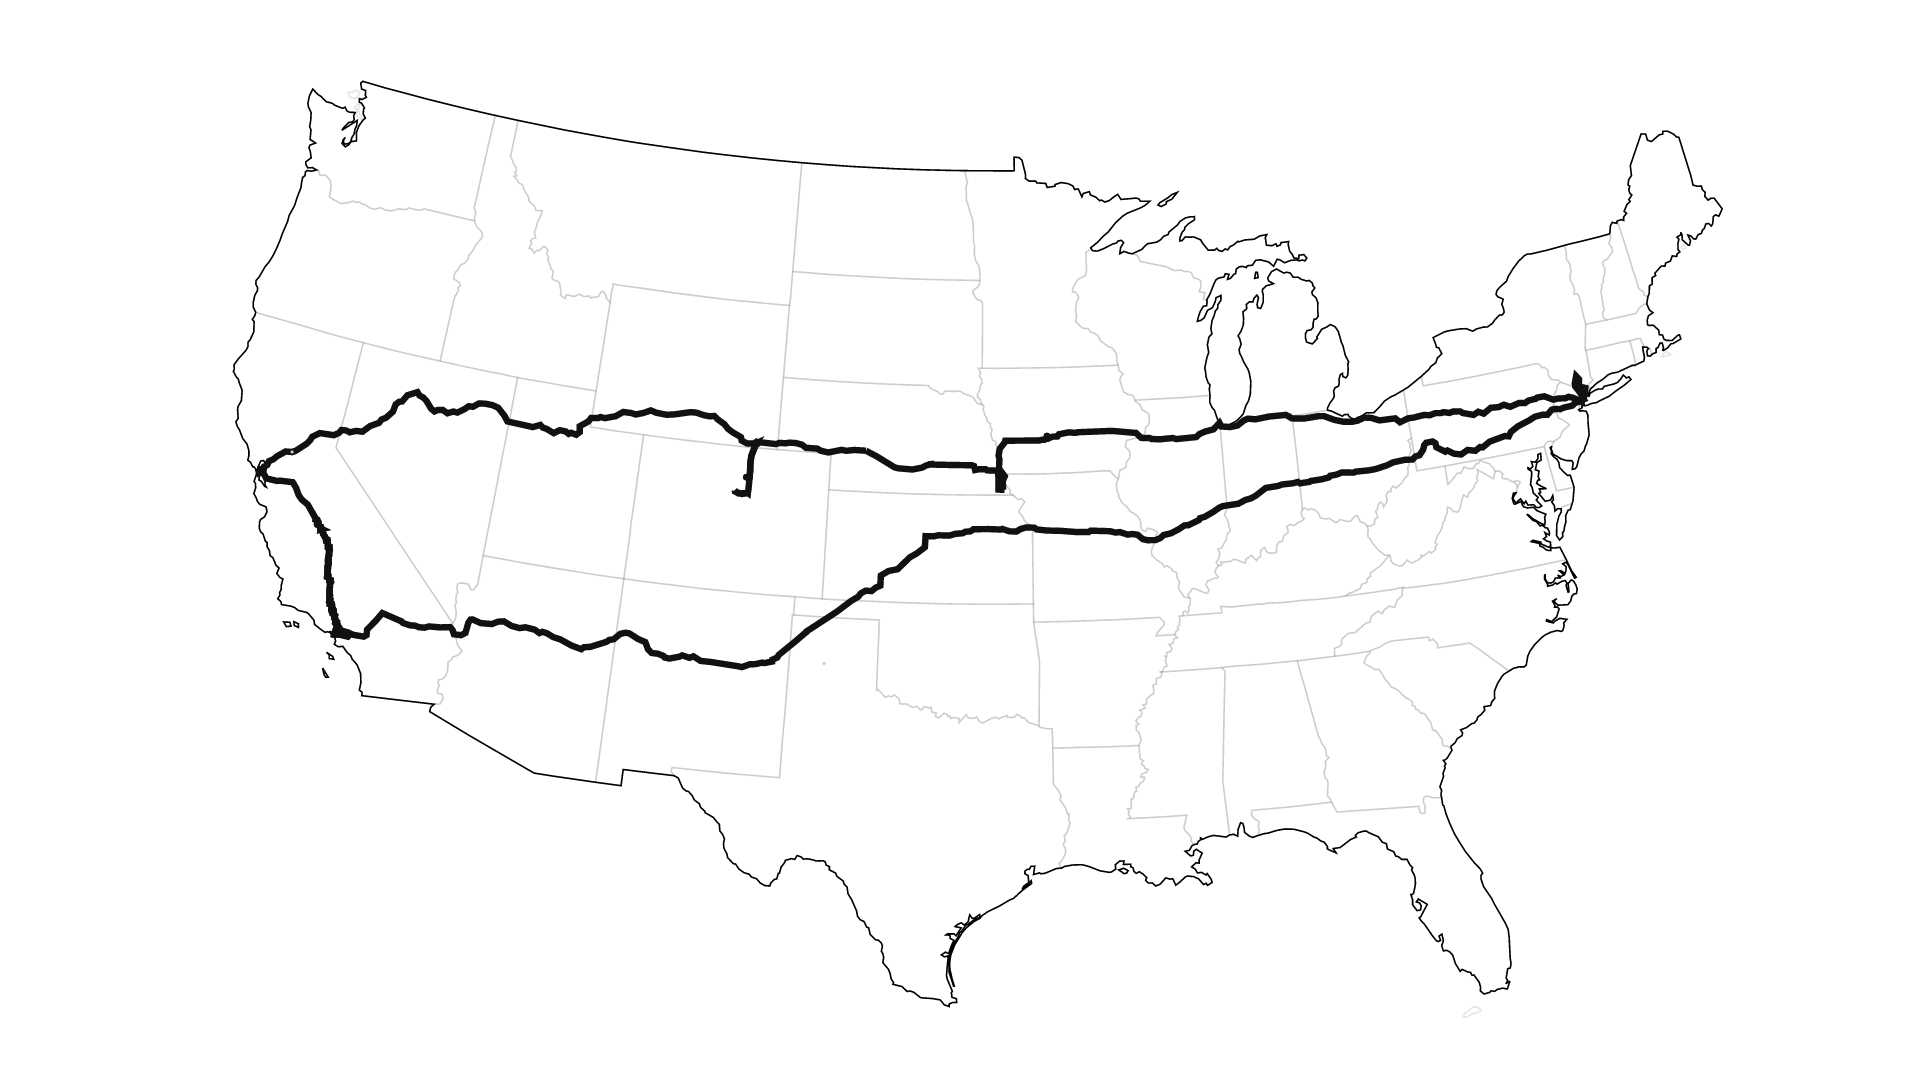
On The Road
An Interactive Map of Jack Kerouac's Novel
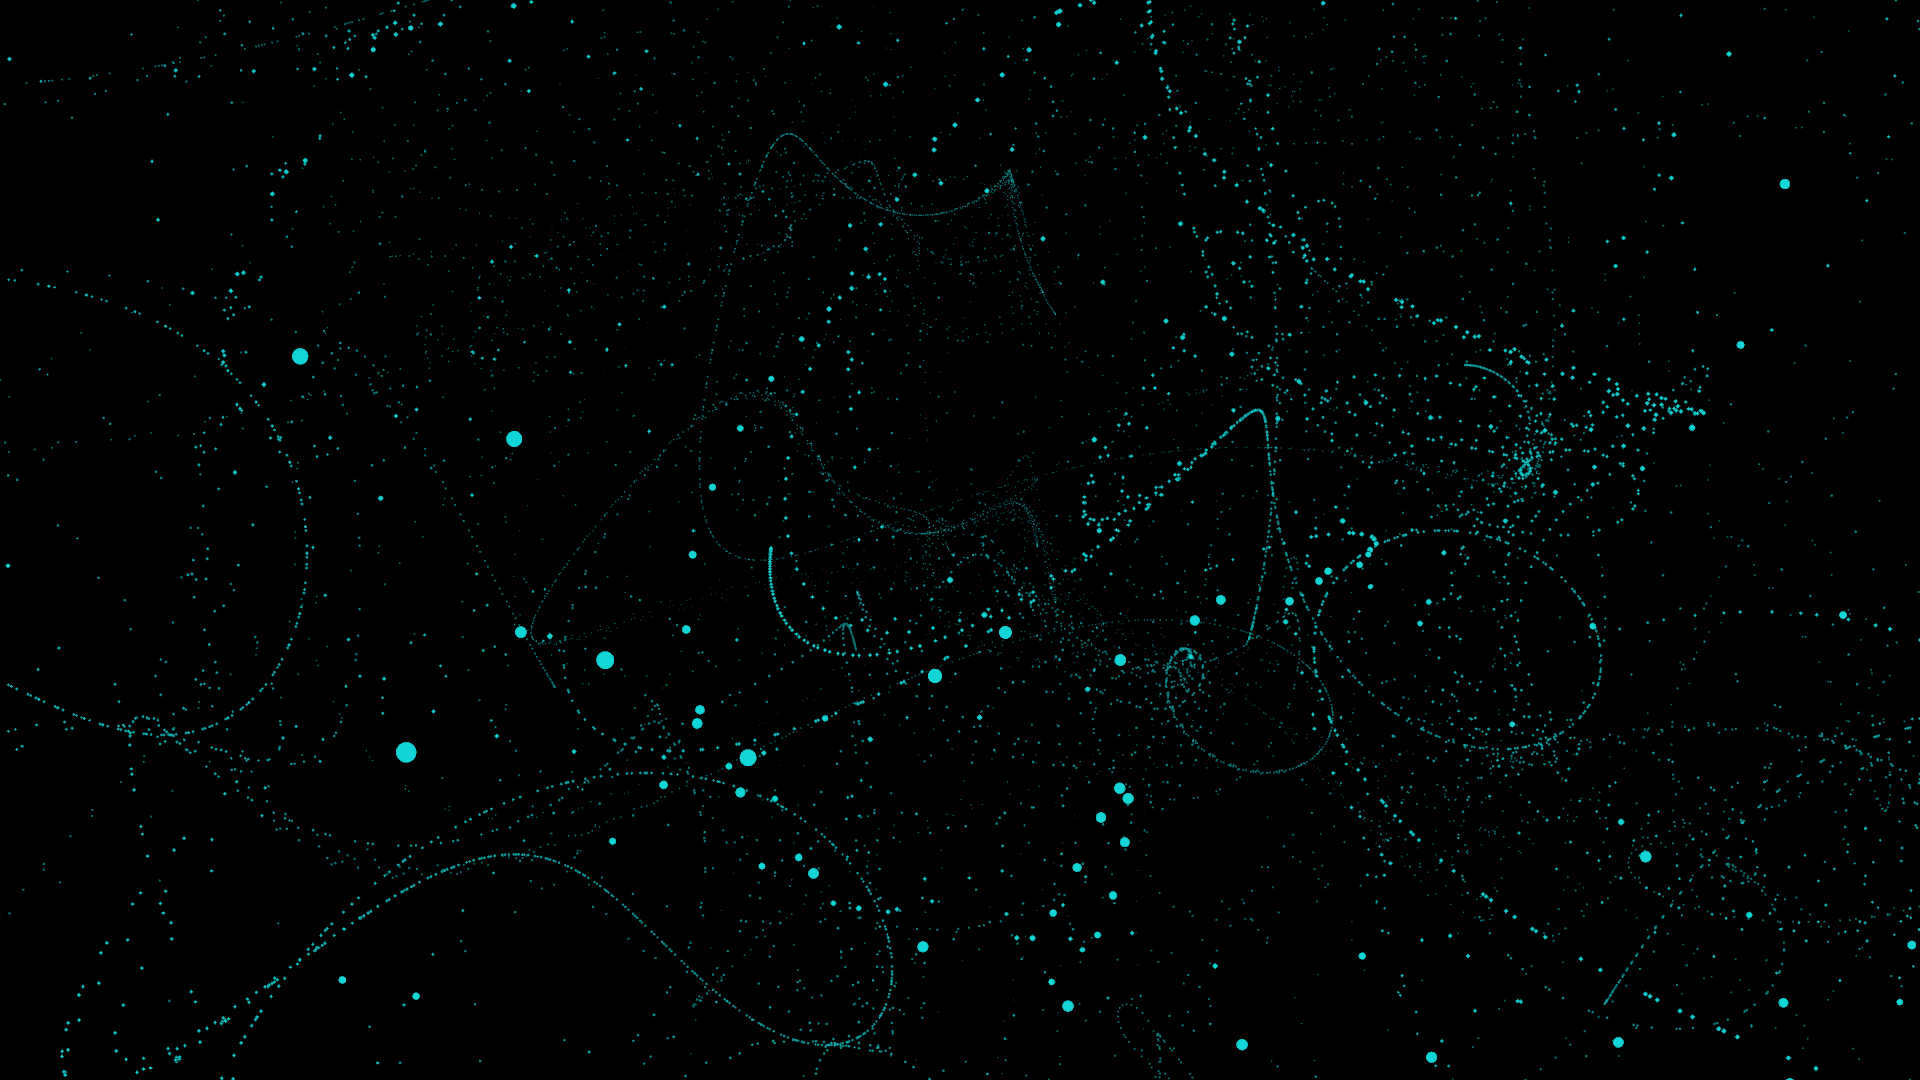
Genuary 2023
A Month of Creative Coding
9 Summits In The Pyrenees
3D immersion in the Pyrenees mountains
Colors In Film
Exploring movies with their colors
Commissioned Work
Preview of some commissioned projects
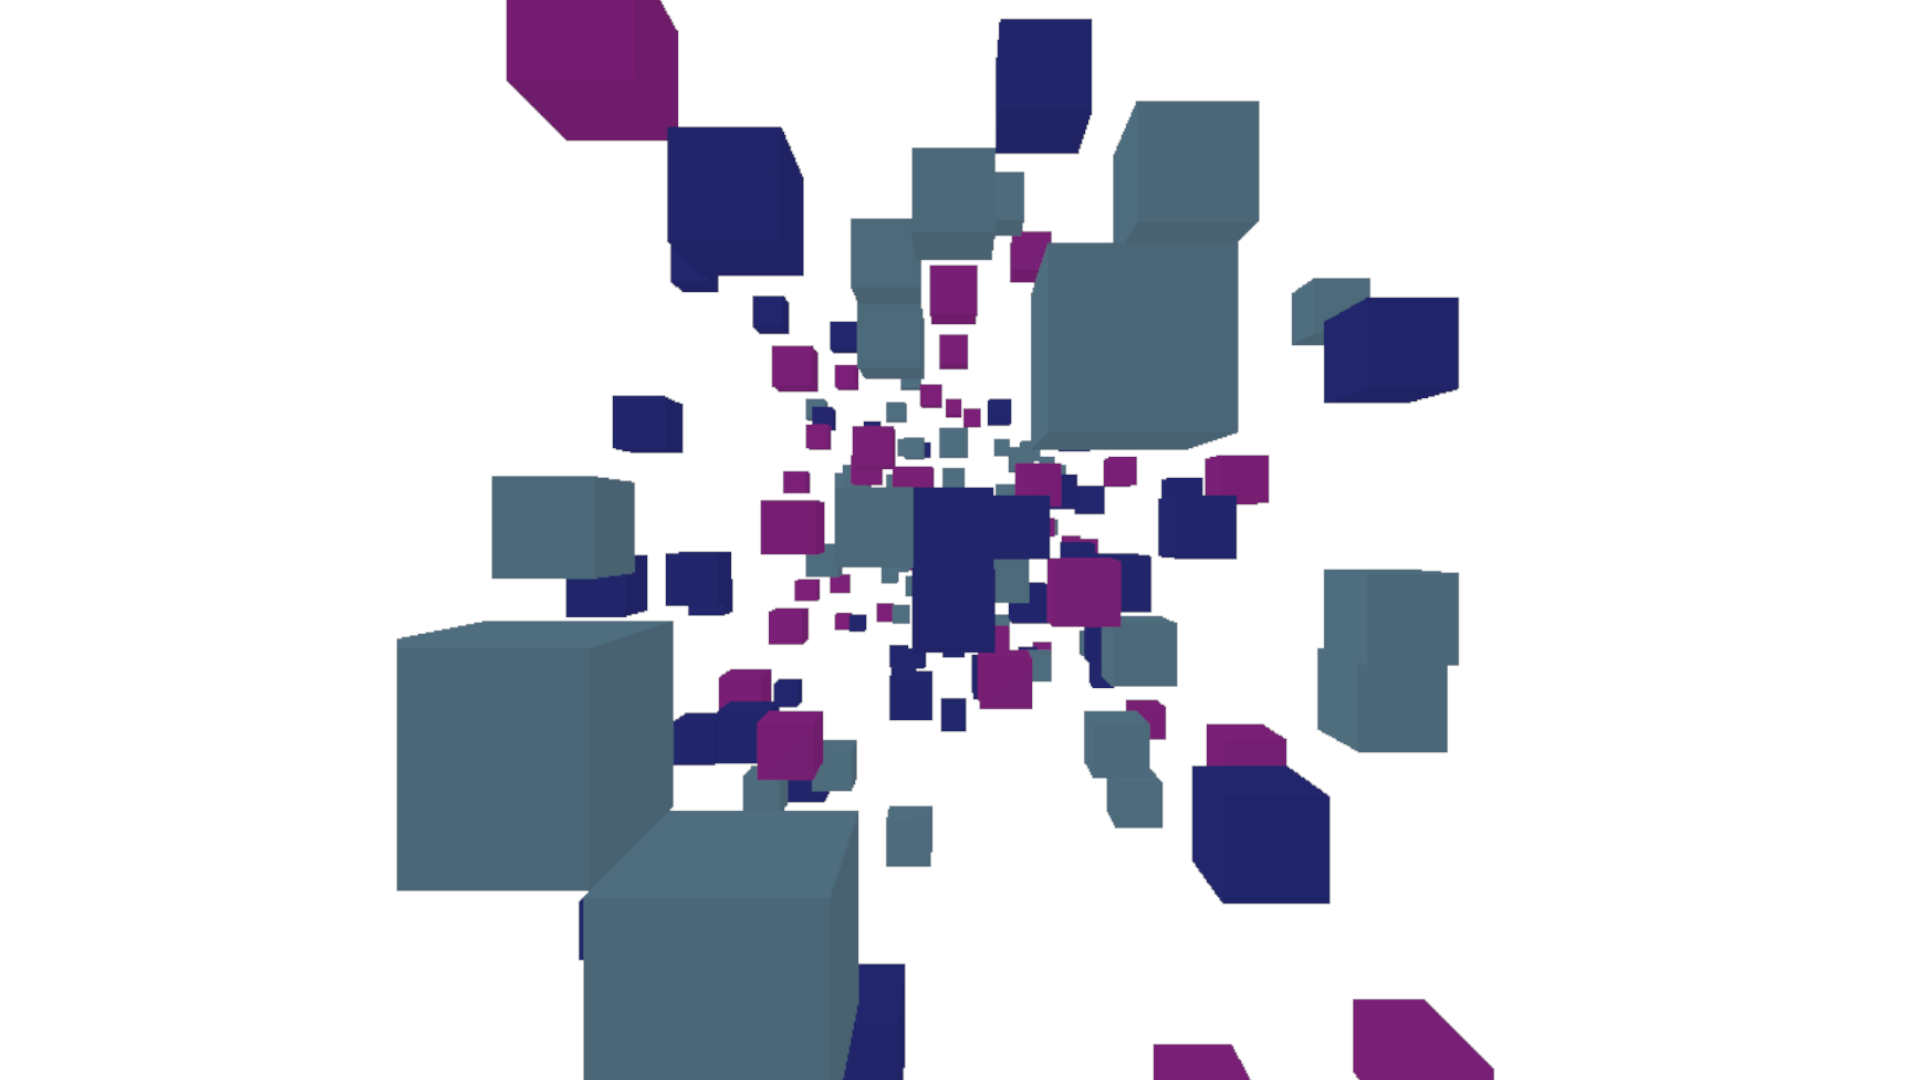
3 · sin(2t + 1)
Sine function effects in 3D graphics
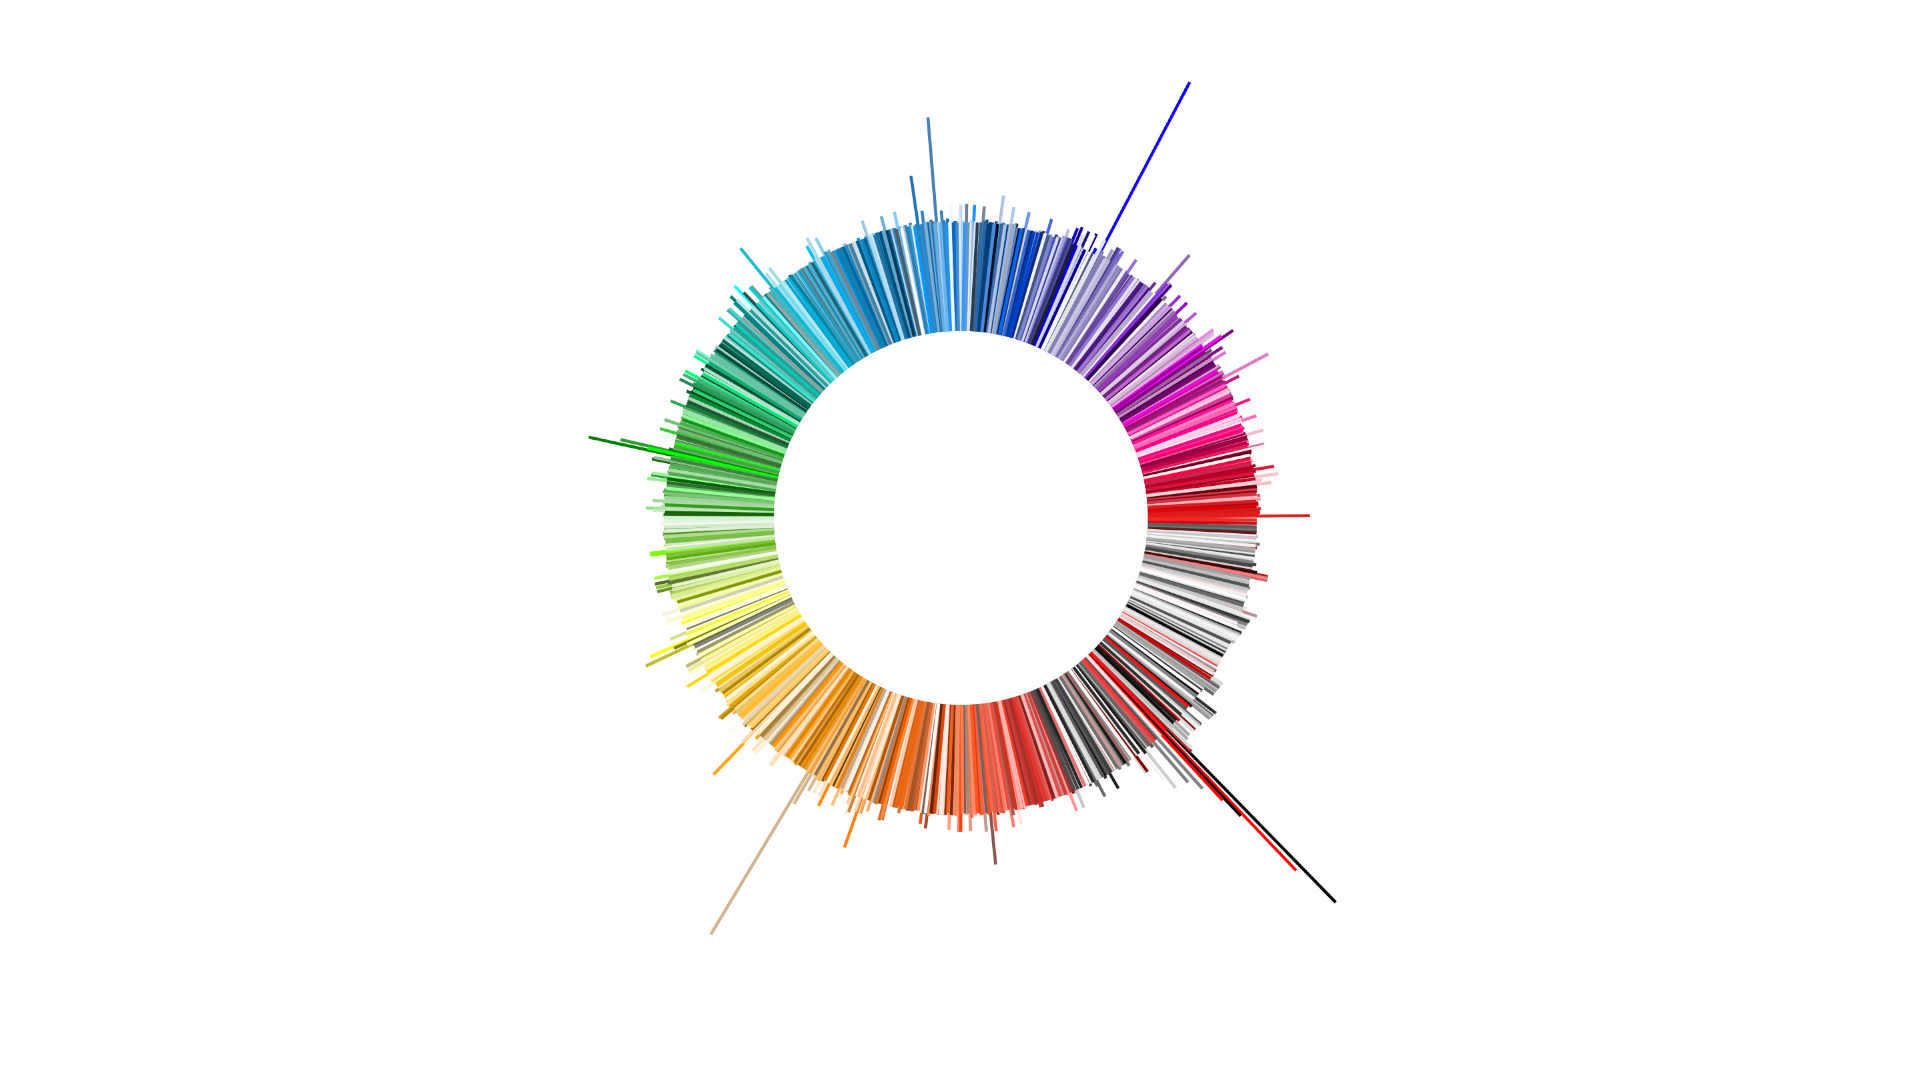
D3.js 10th Anniversary
1,000 most frequent colors used with d3.js
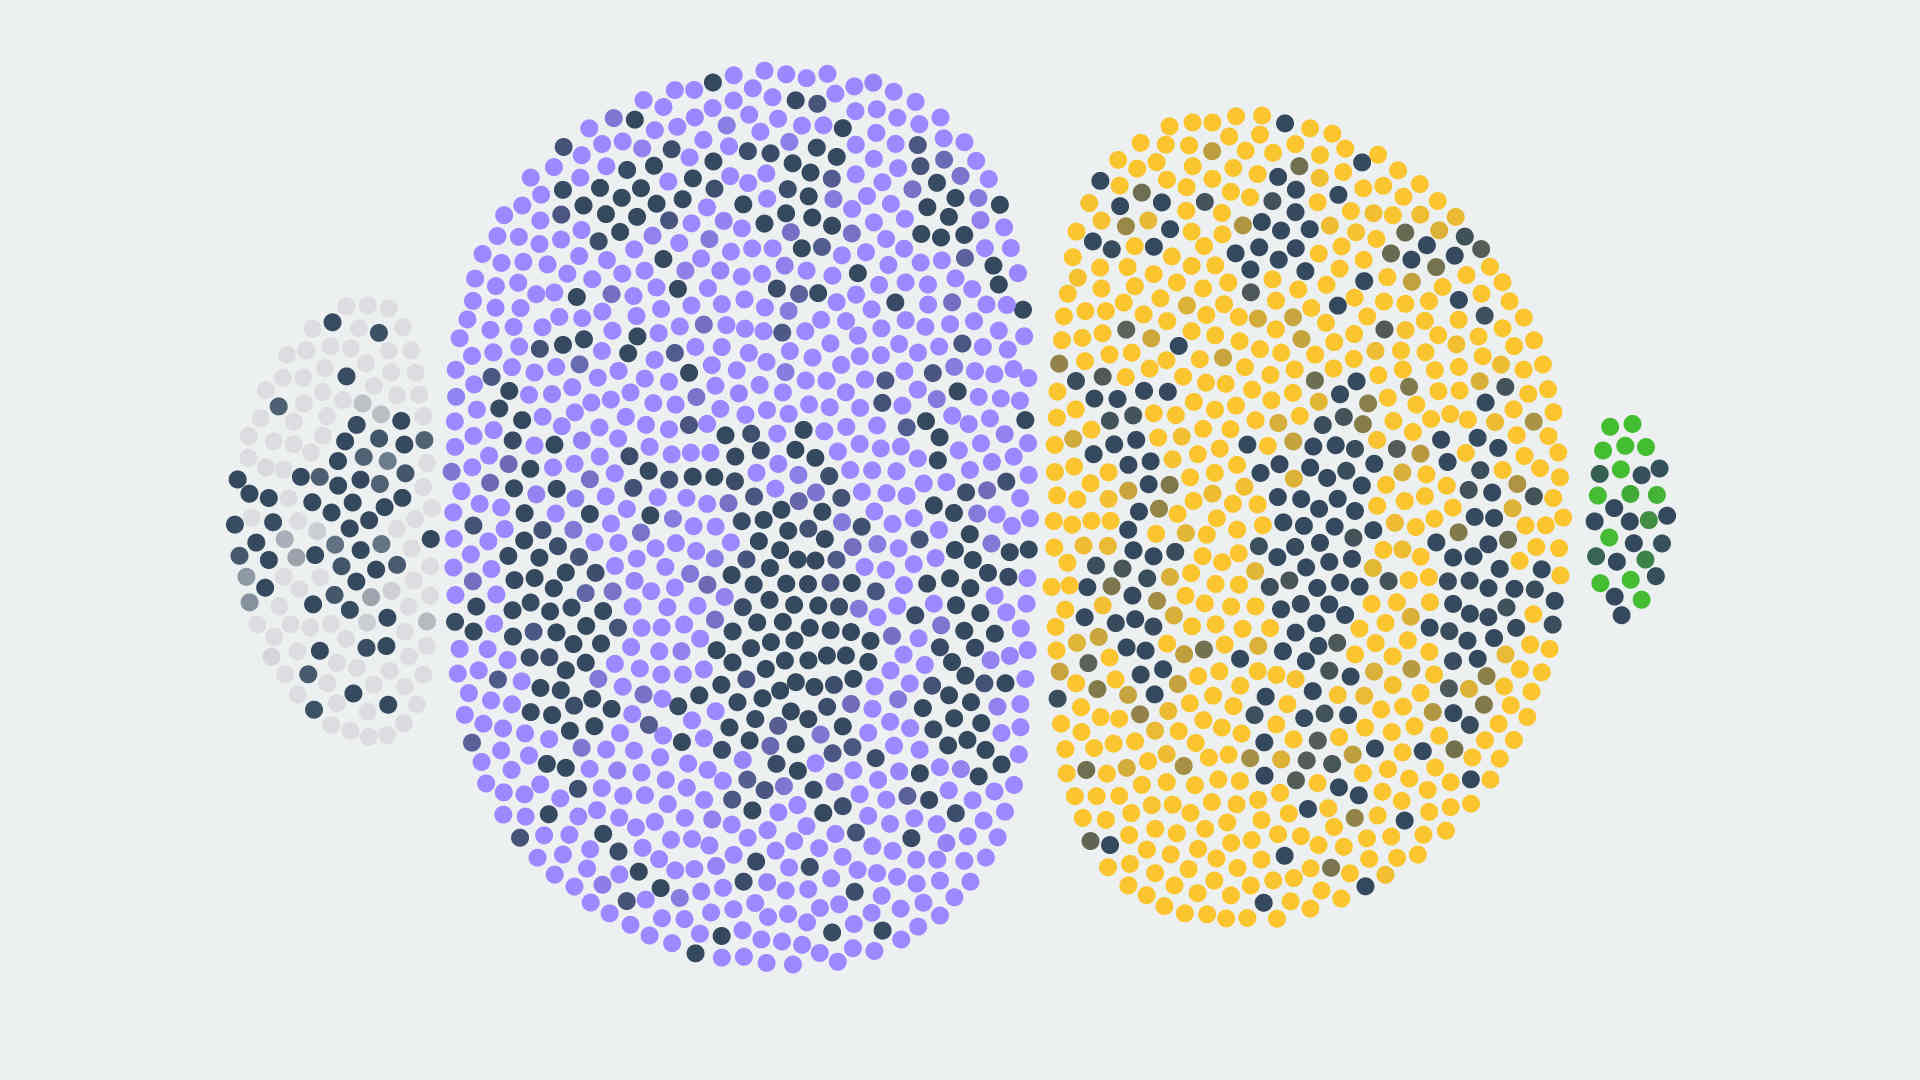
Among Us
Data Visualization Society survey, Jury Prize
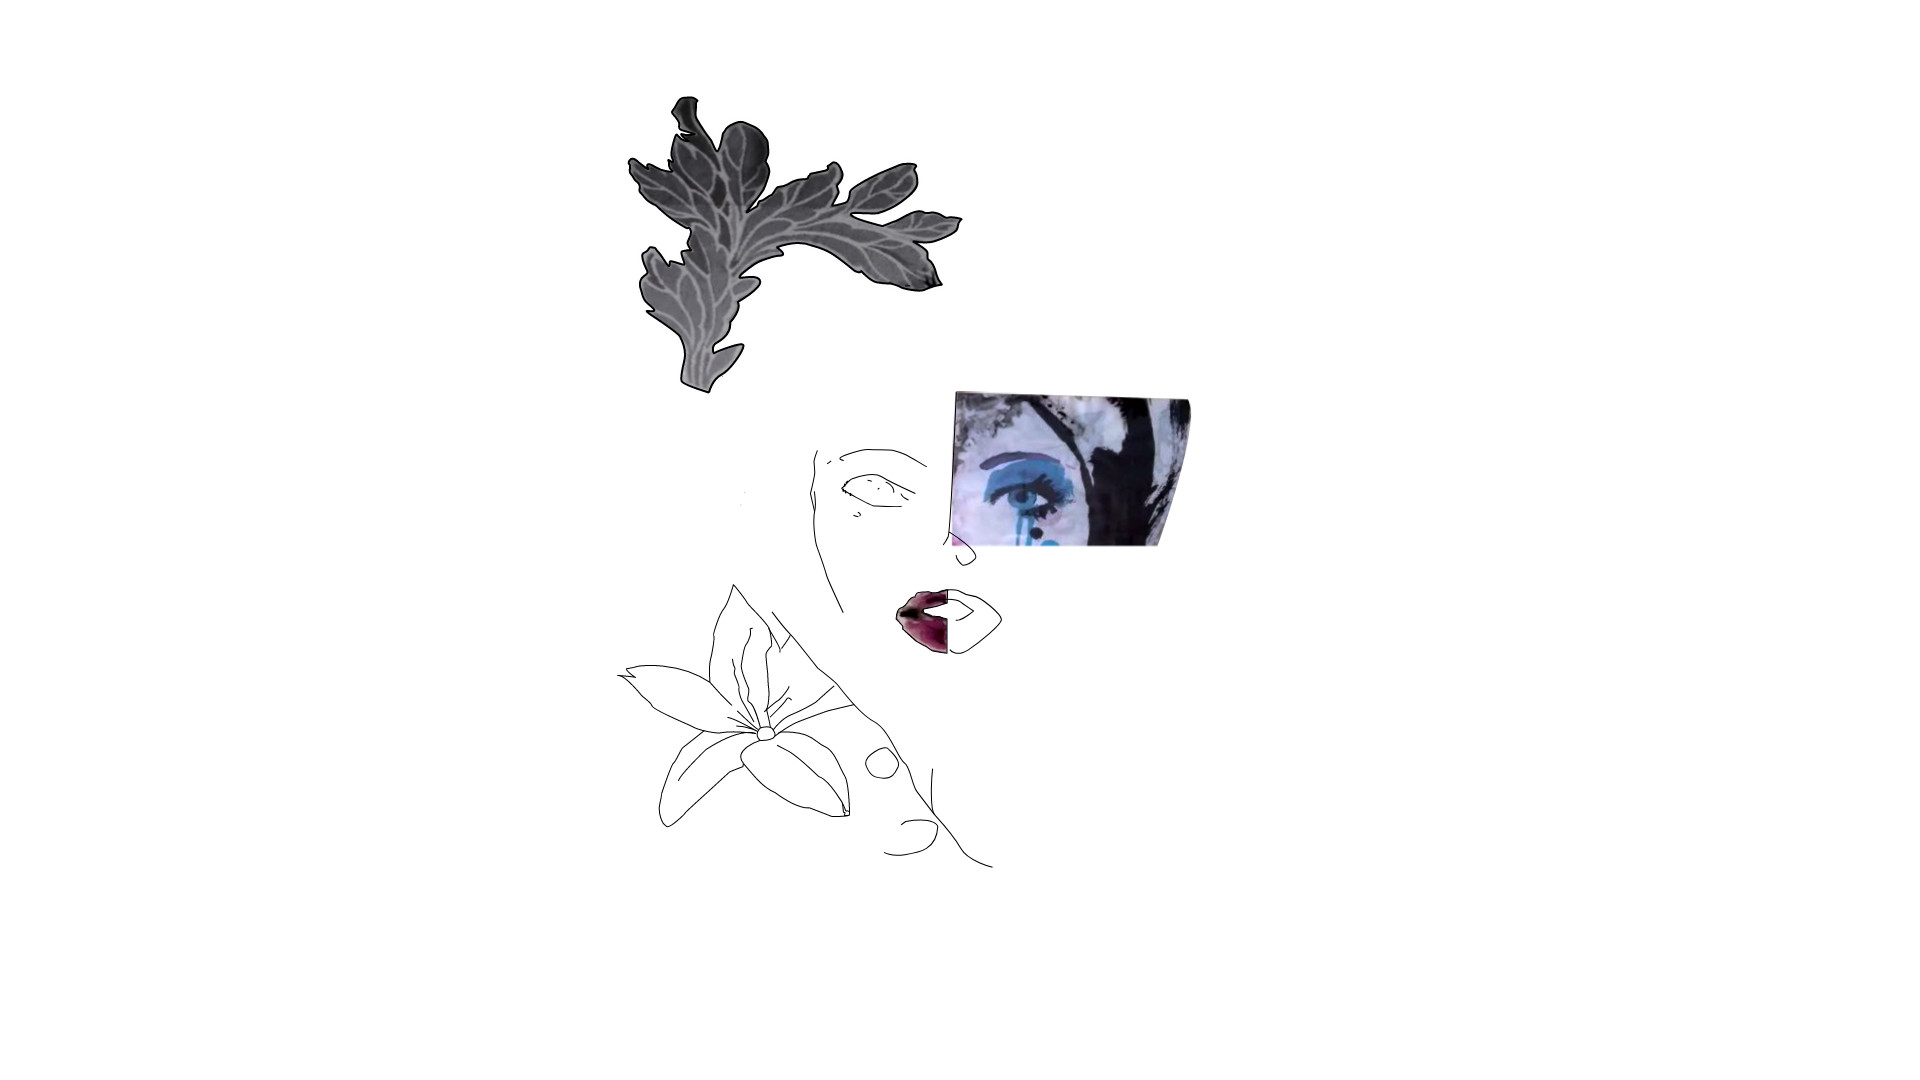
A L'Ombre Des Jeunes Filles
Experimenting collage, drawing and code
© 2020-2023 Loris Mat