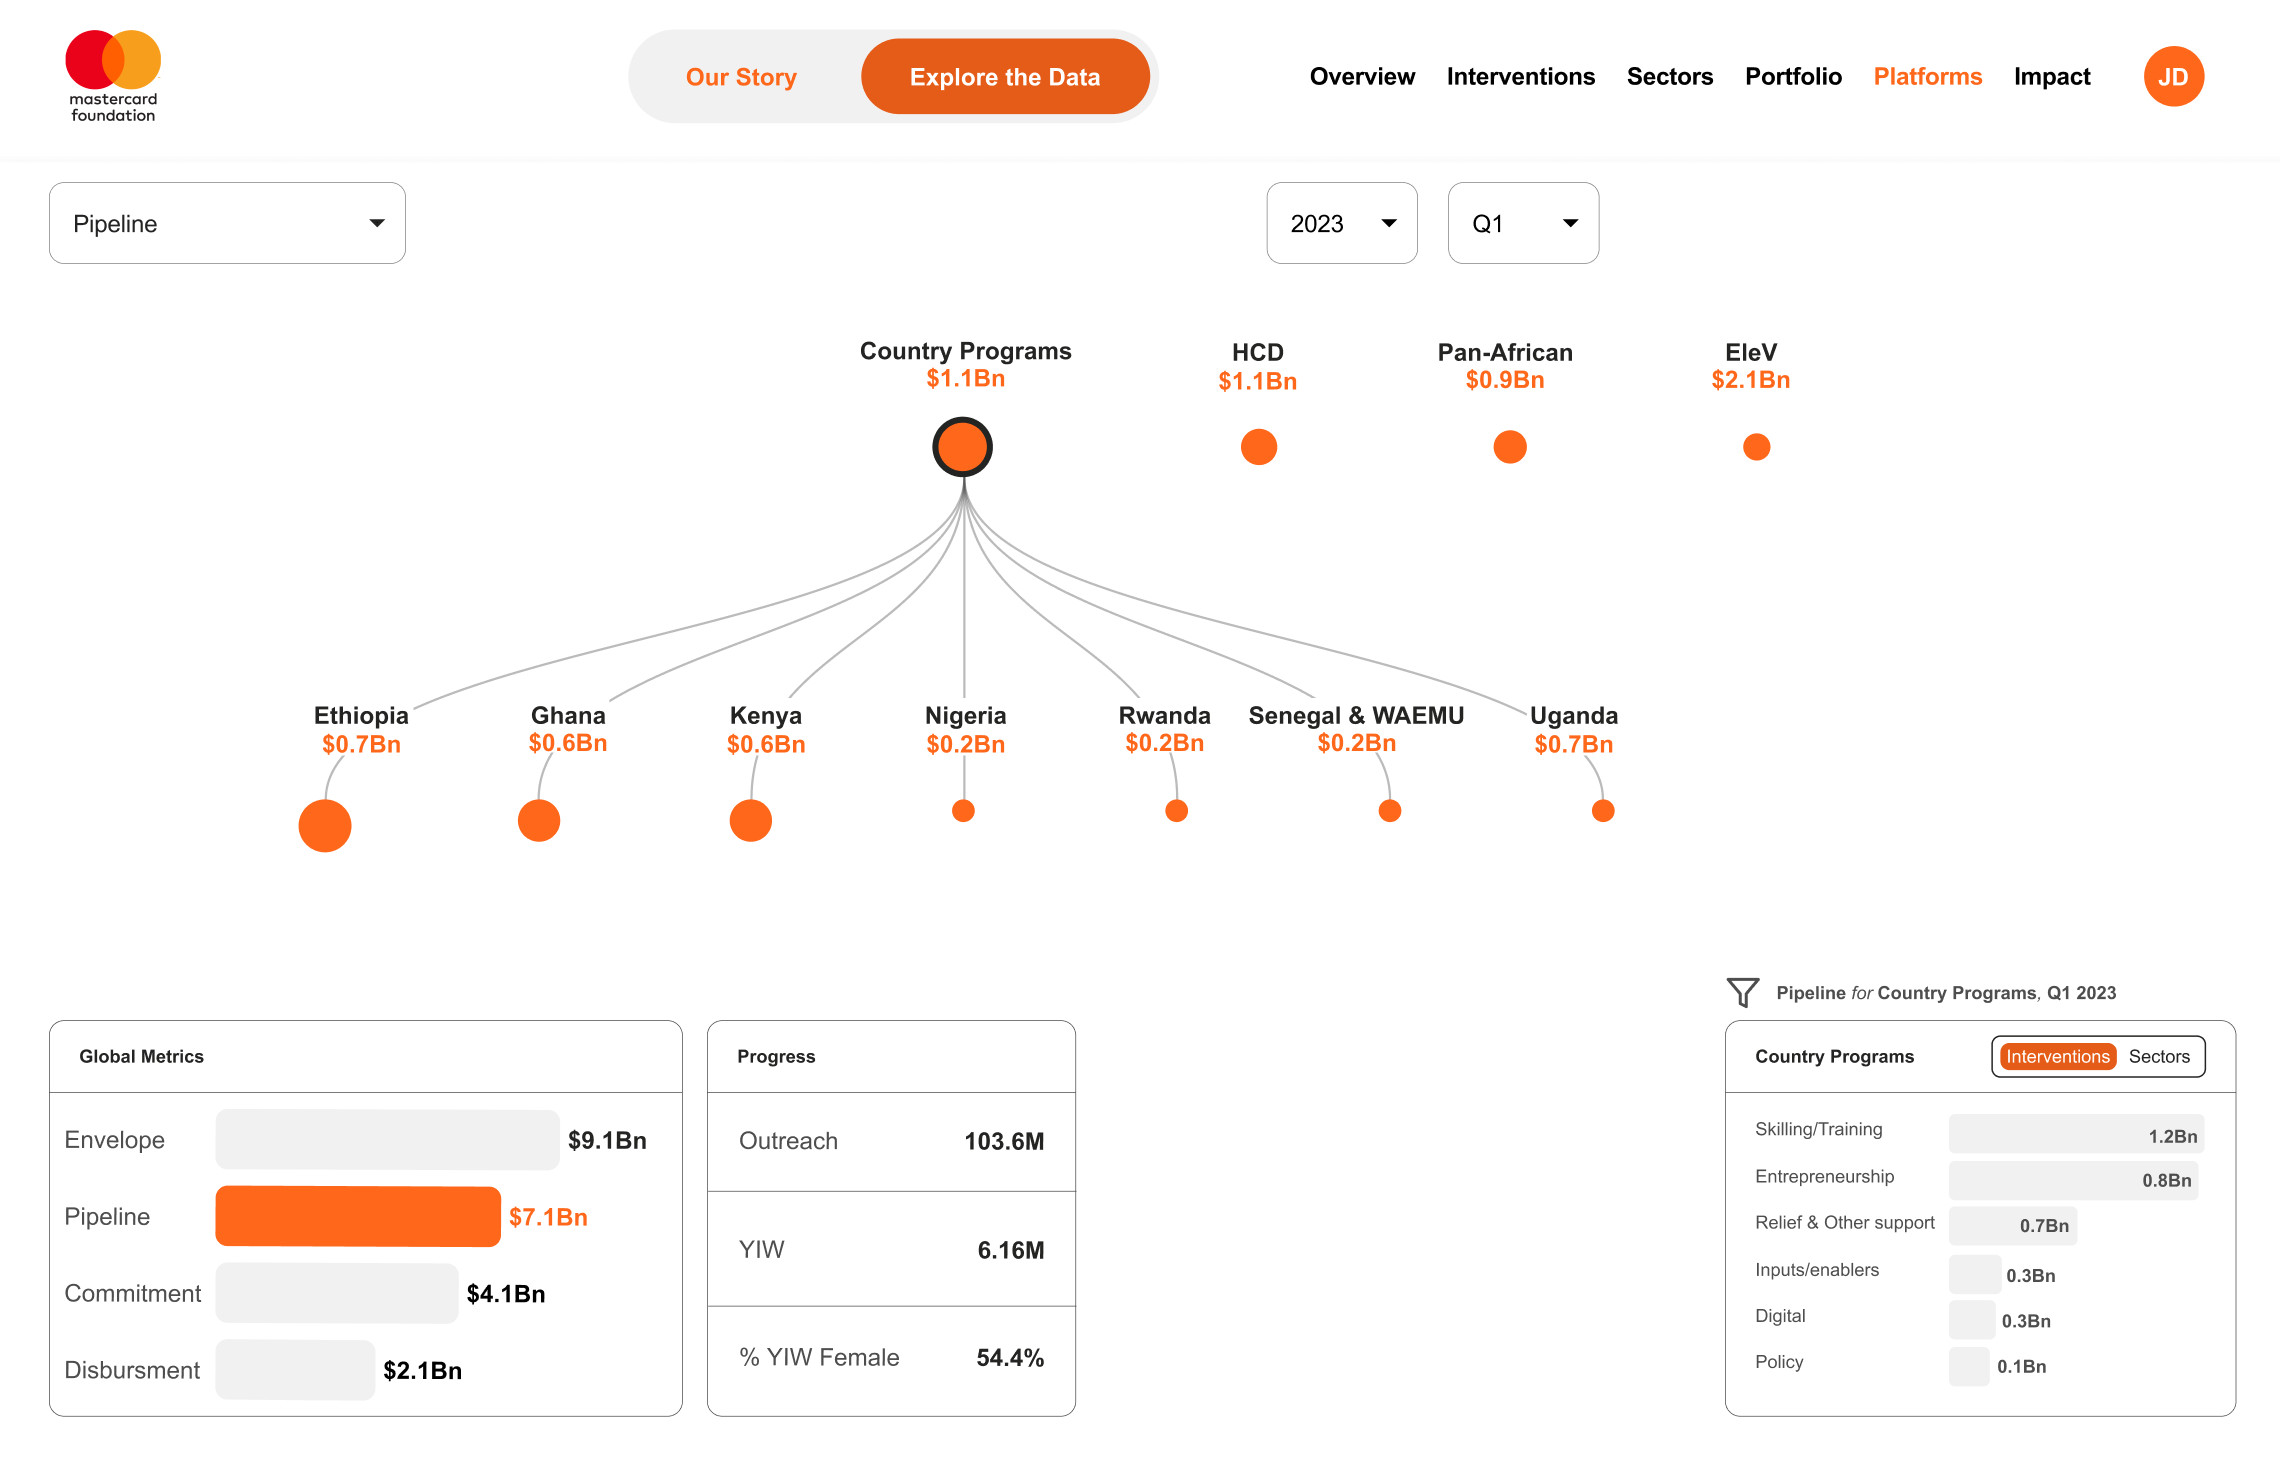
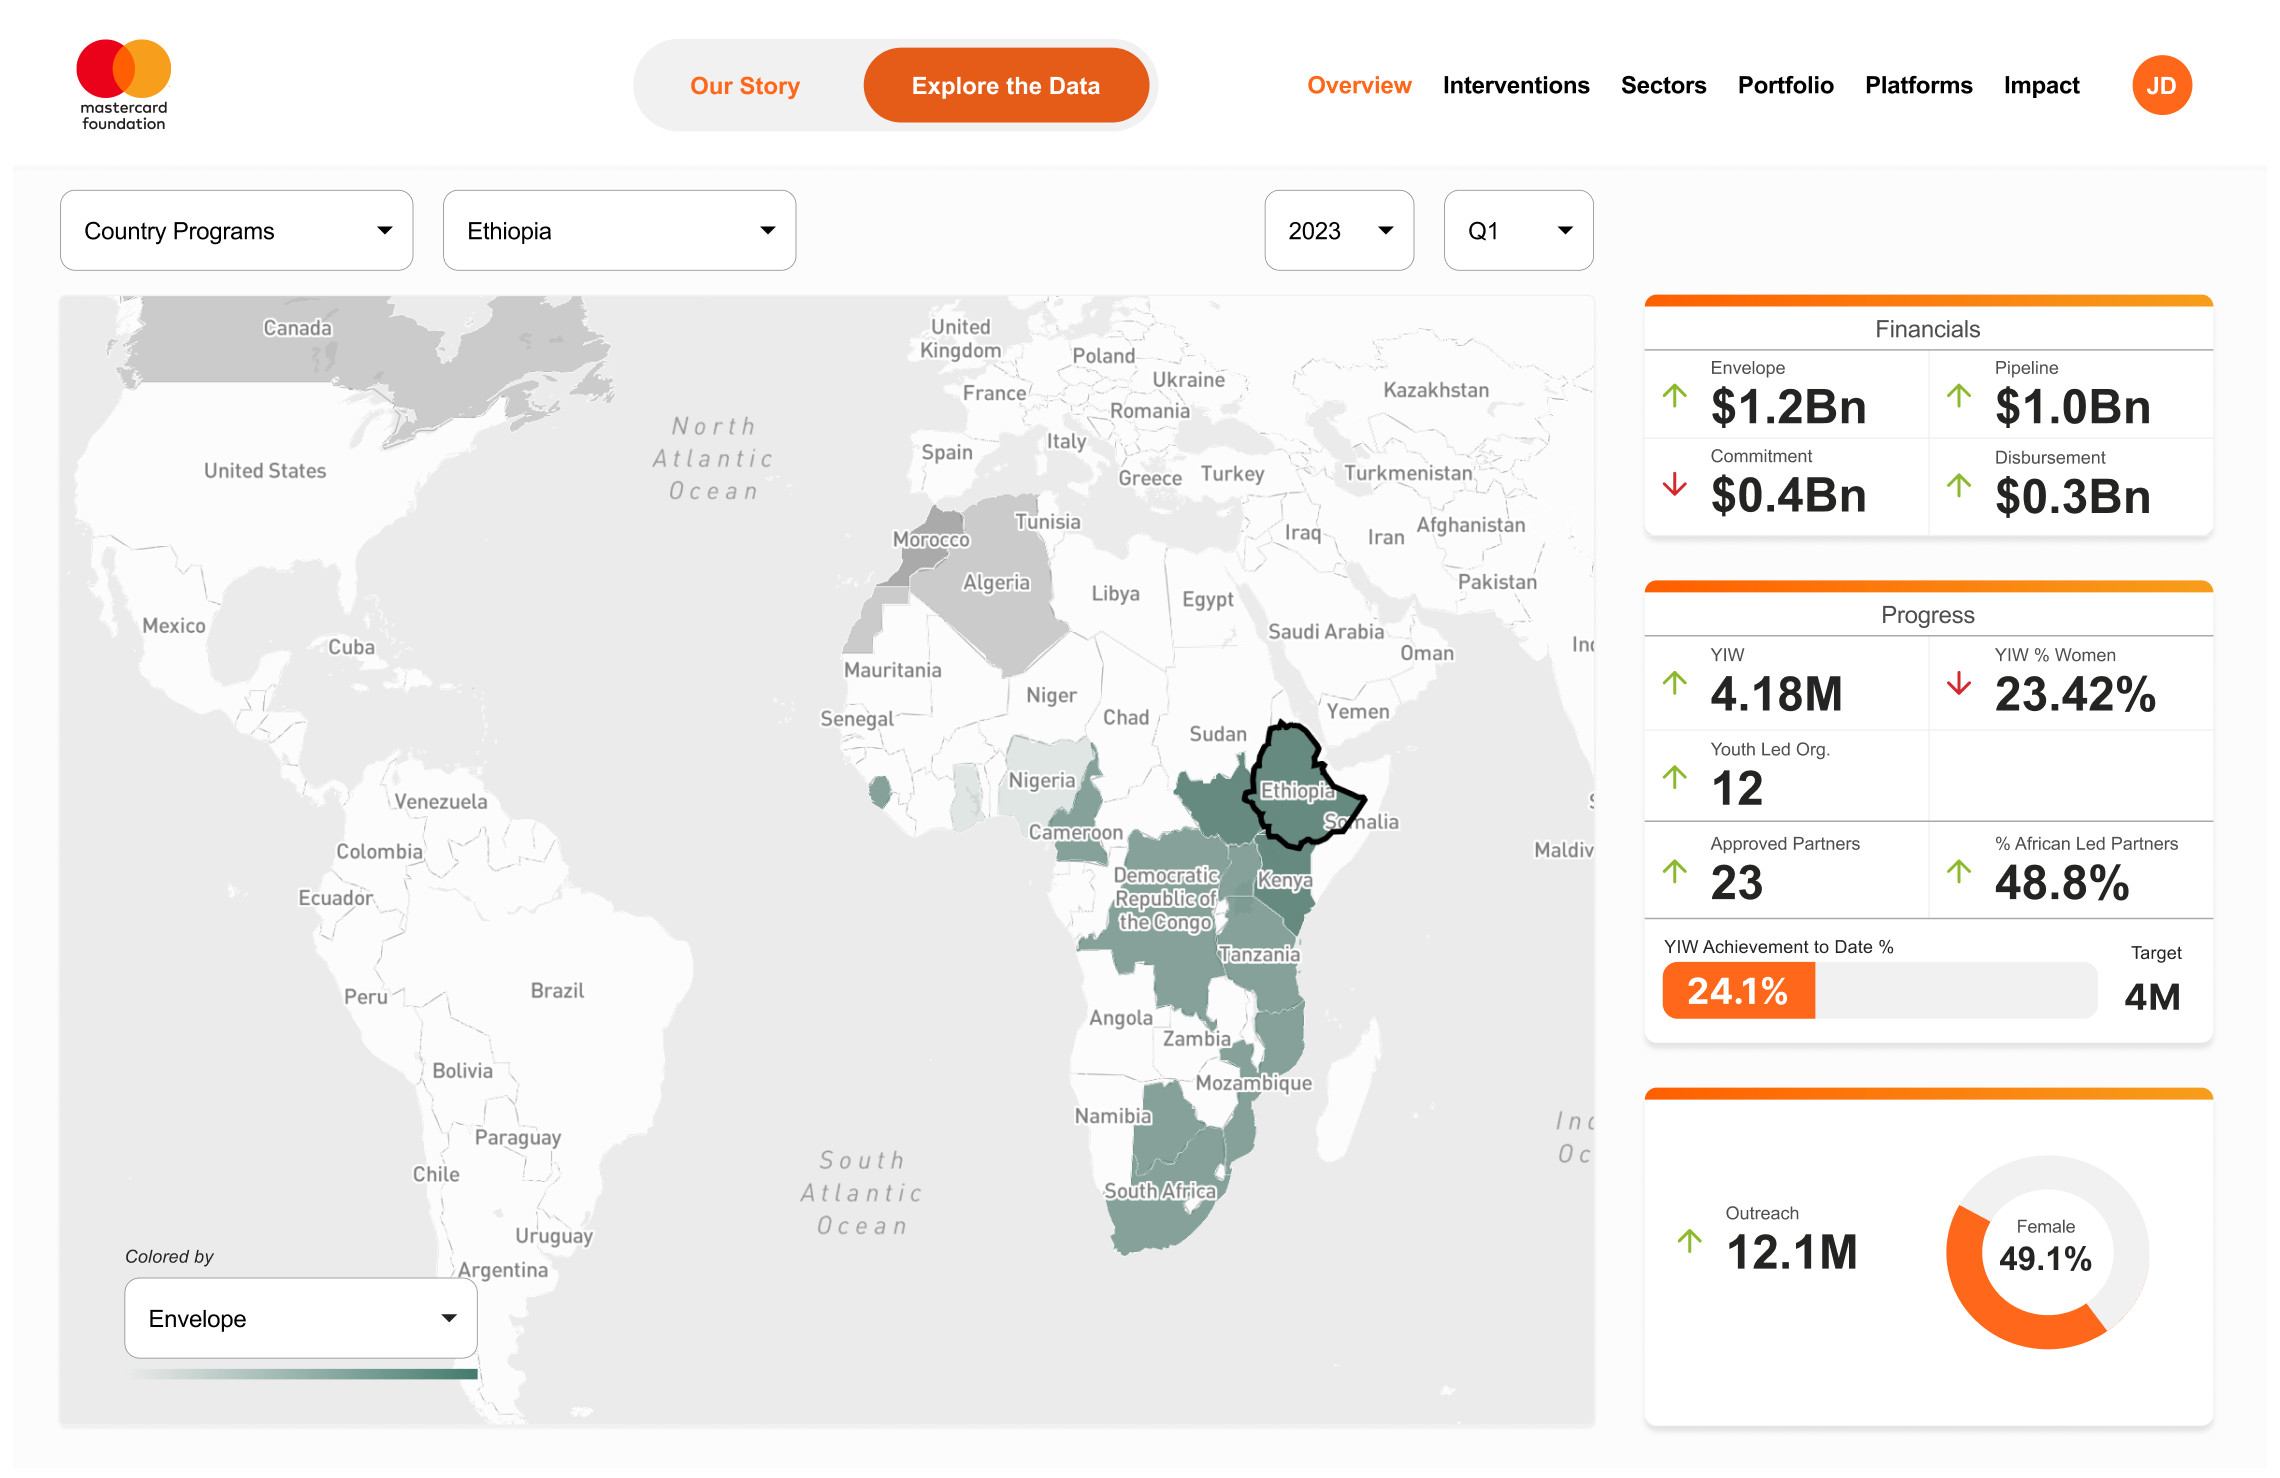
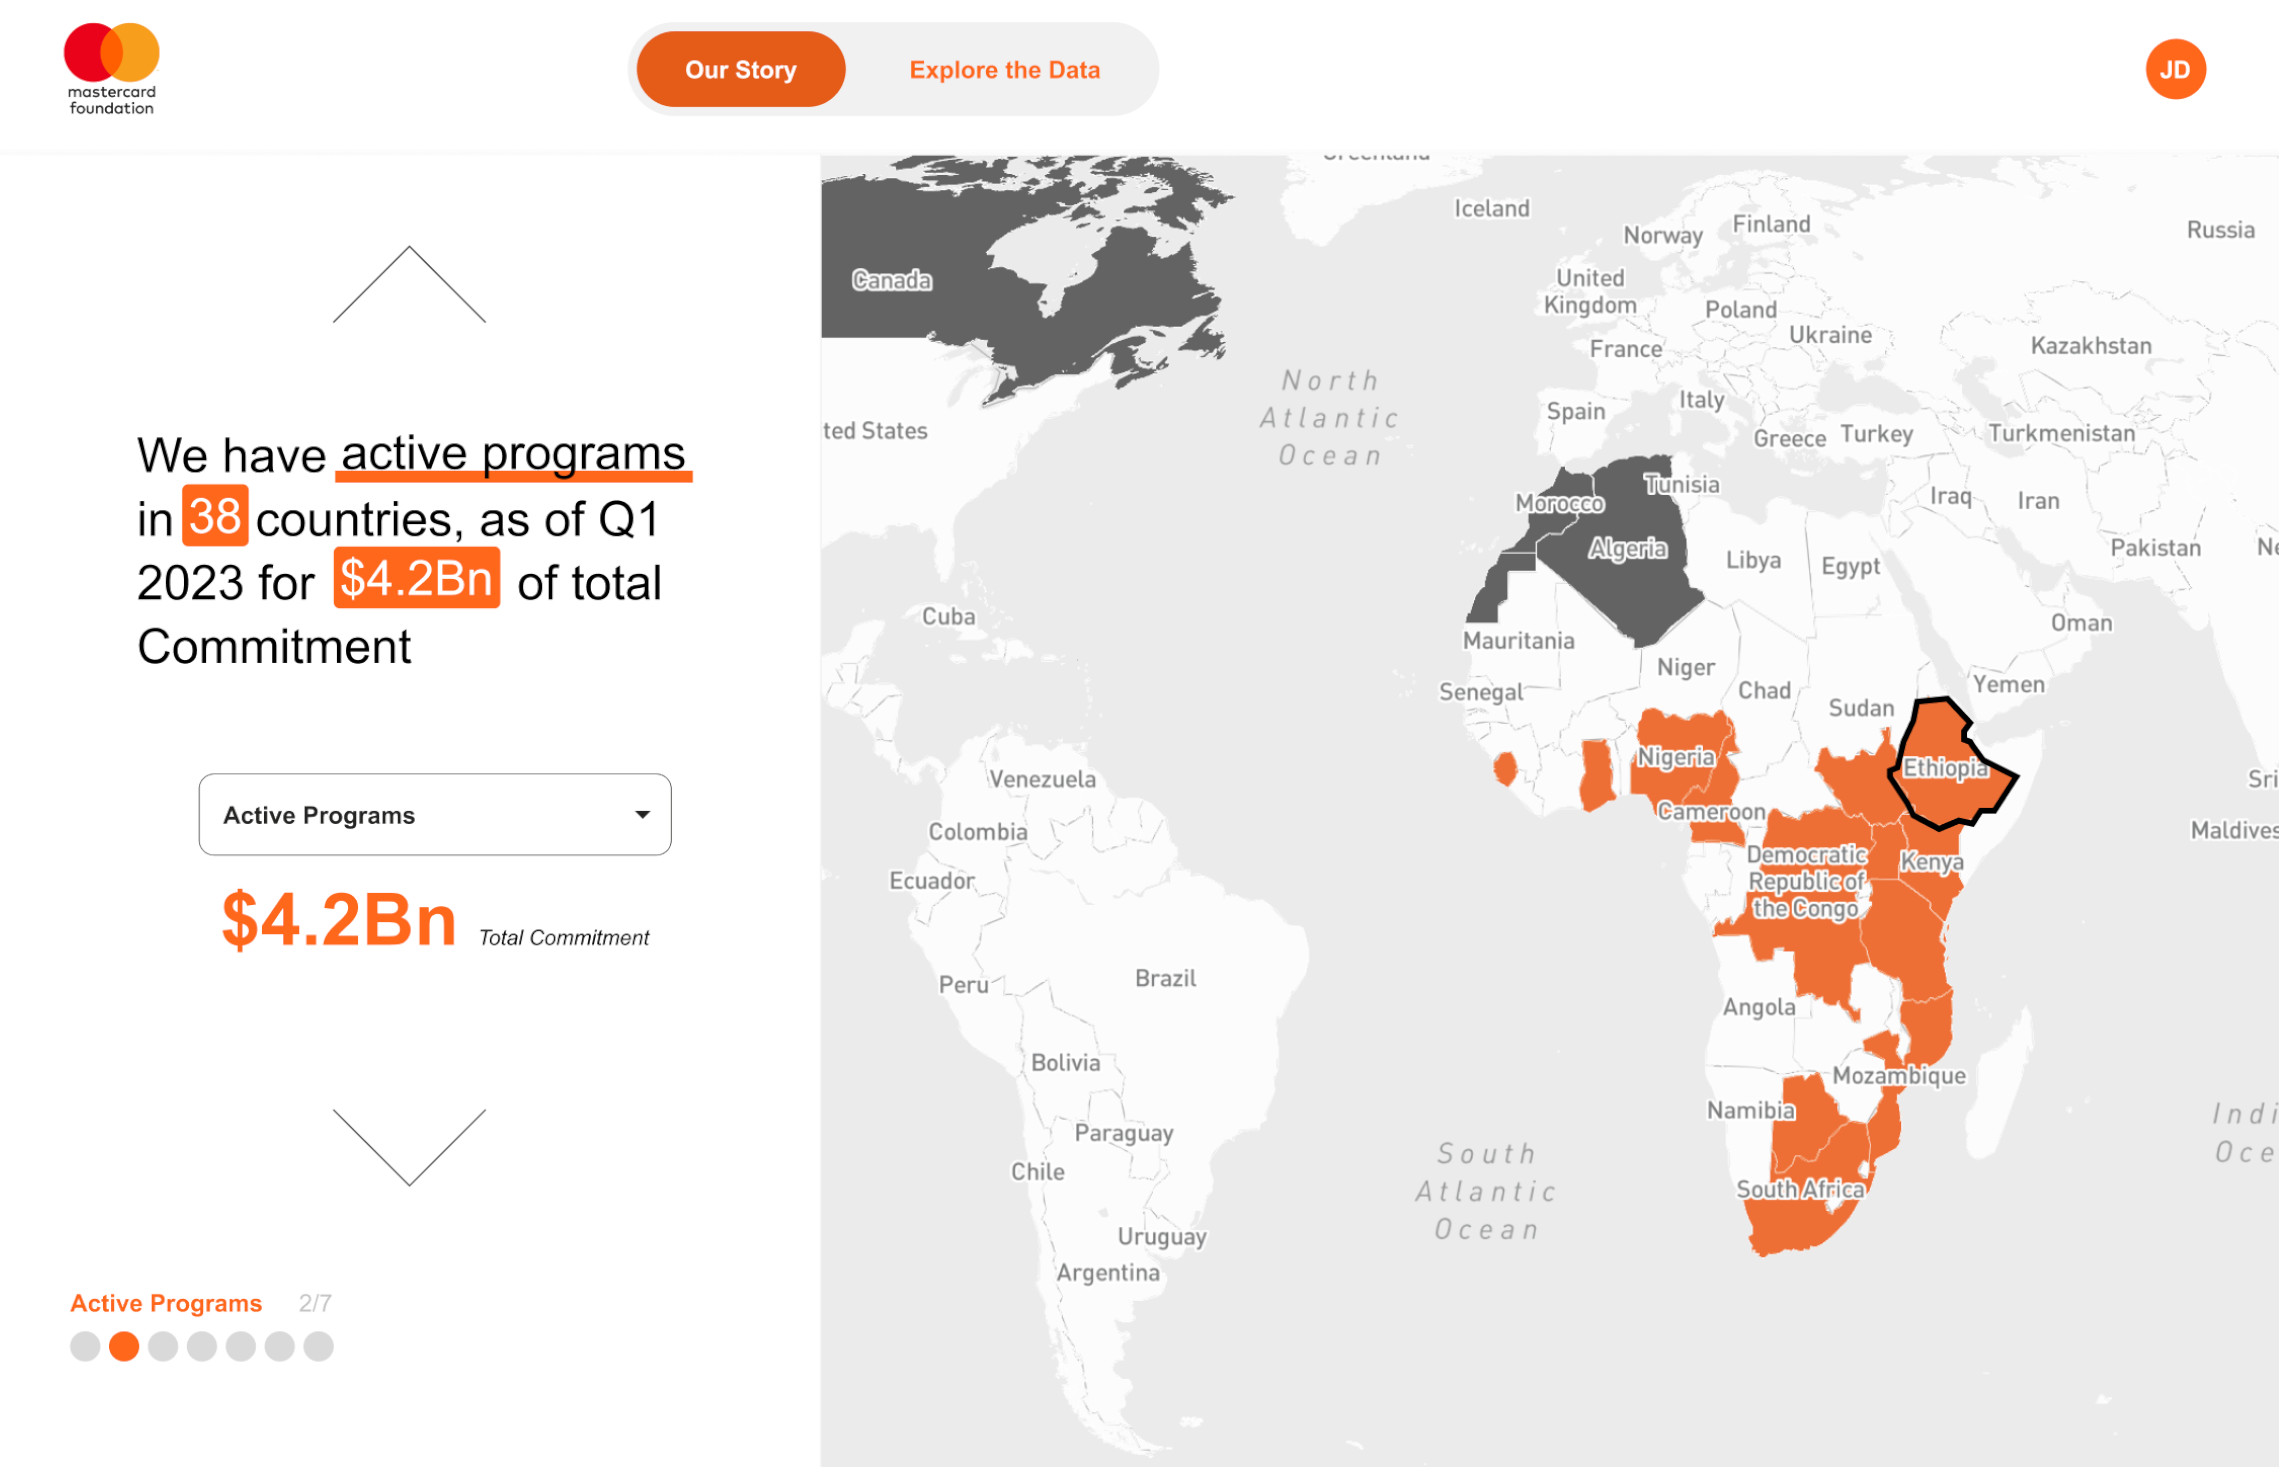
Collaborating closely with the Mastercard Foundation's team, I spearheaded the storytelling and design aspects of their African Youth initiative's dashboard. The objective was to craft a compelling visual narrative, enabling data-driven decisions and offering a concise overview of the foundation's impact in Africa.
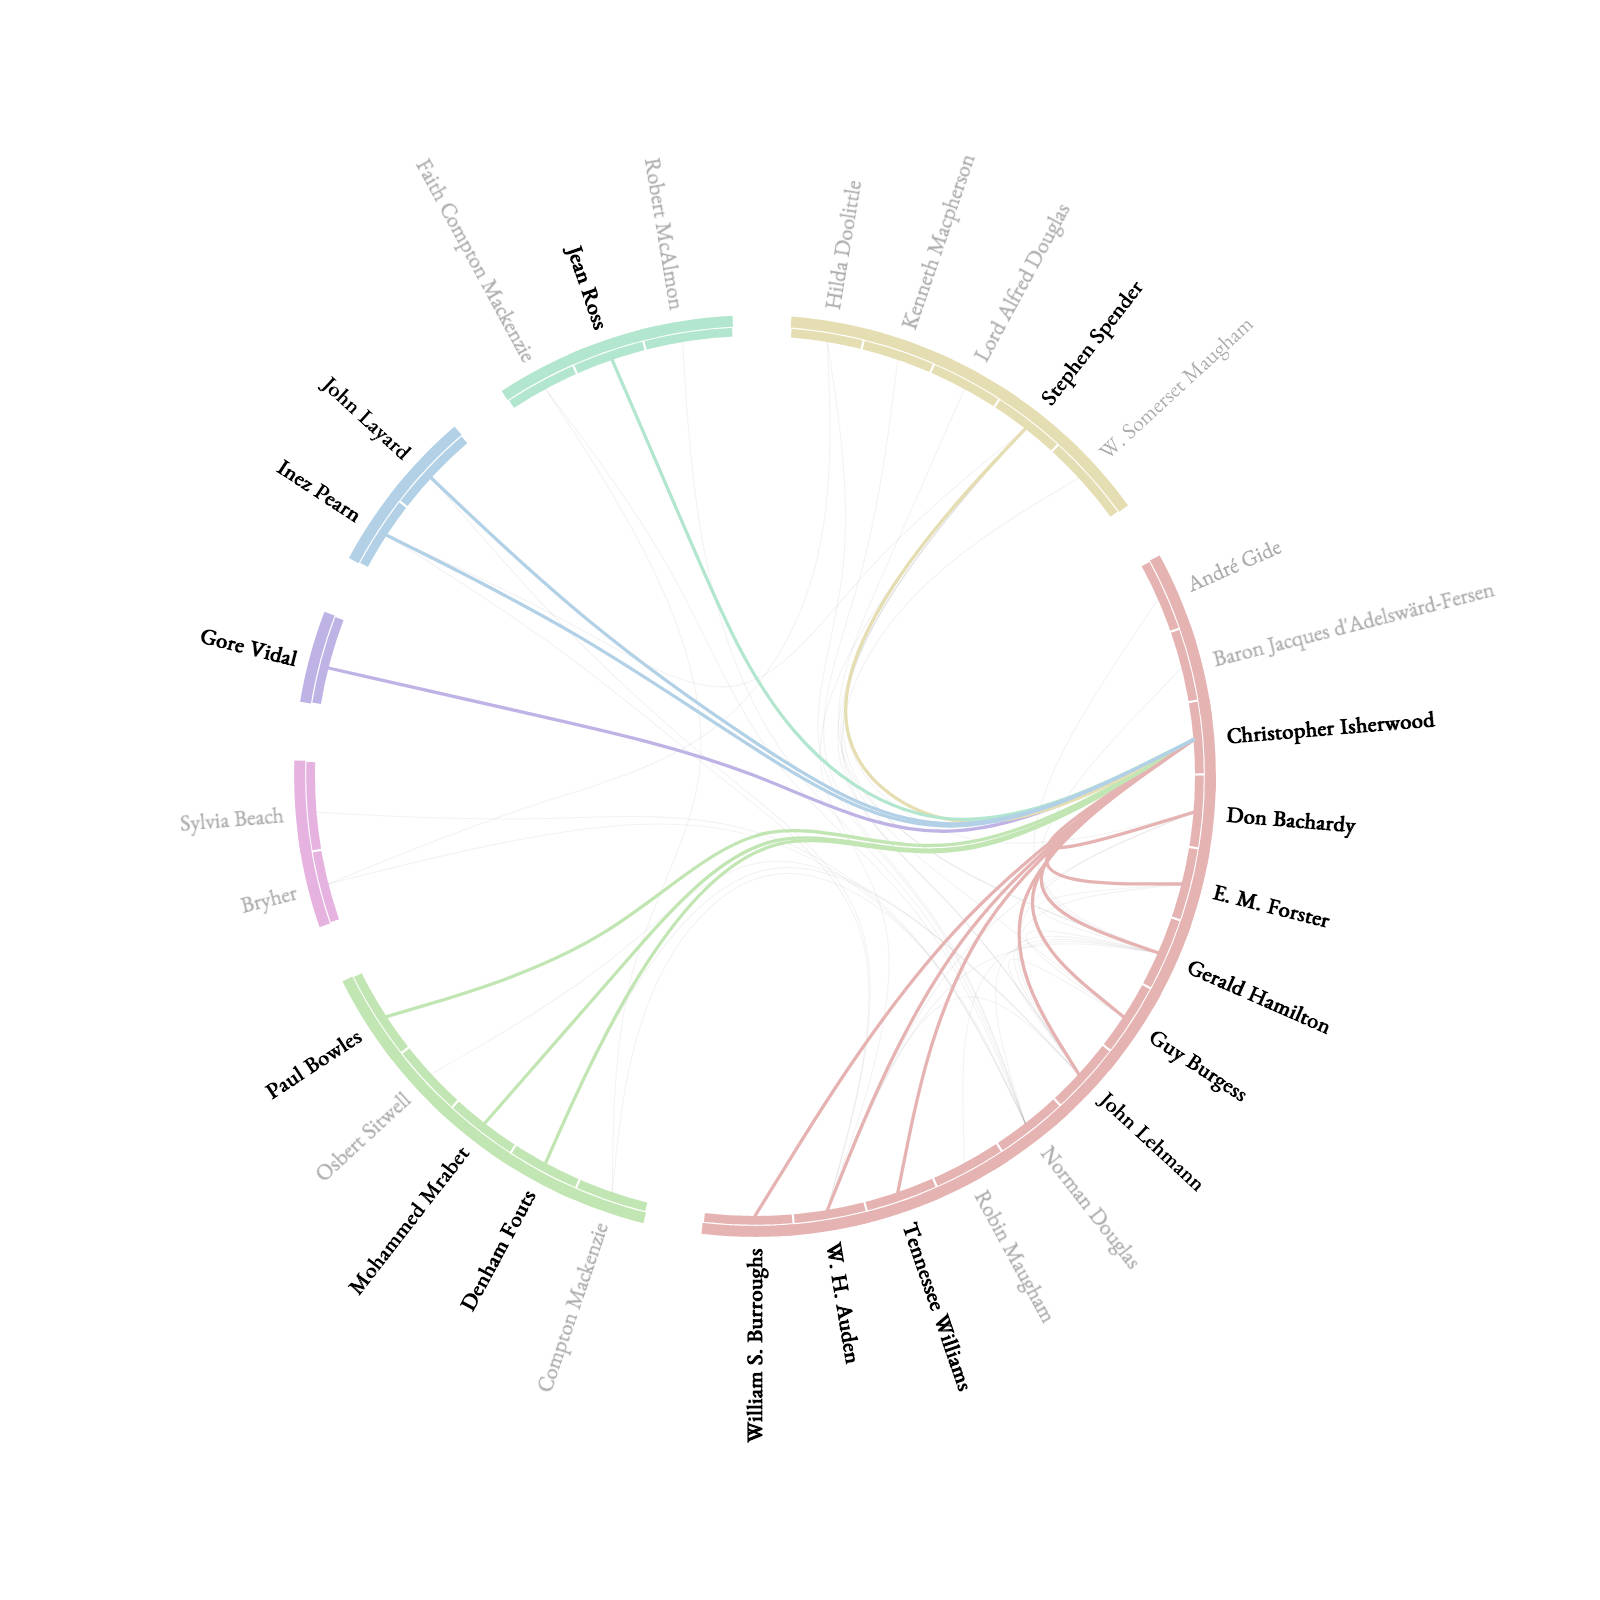
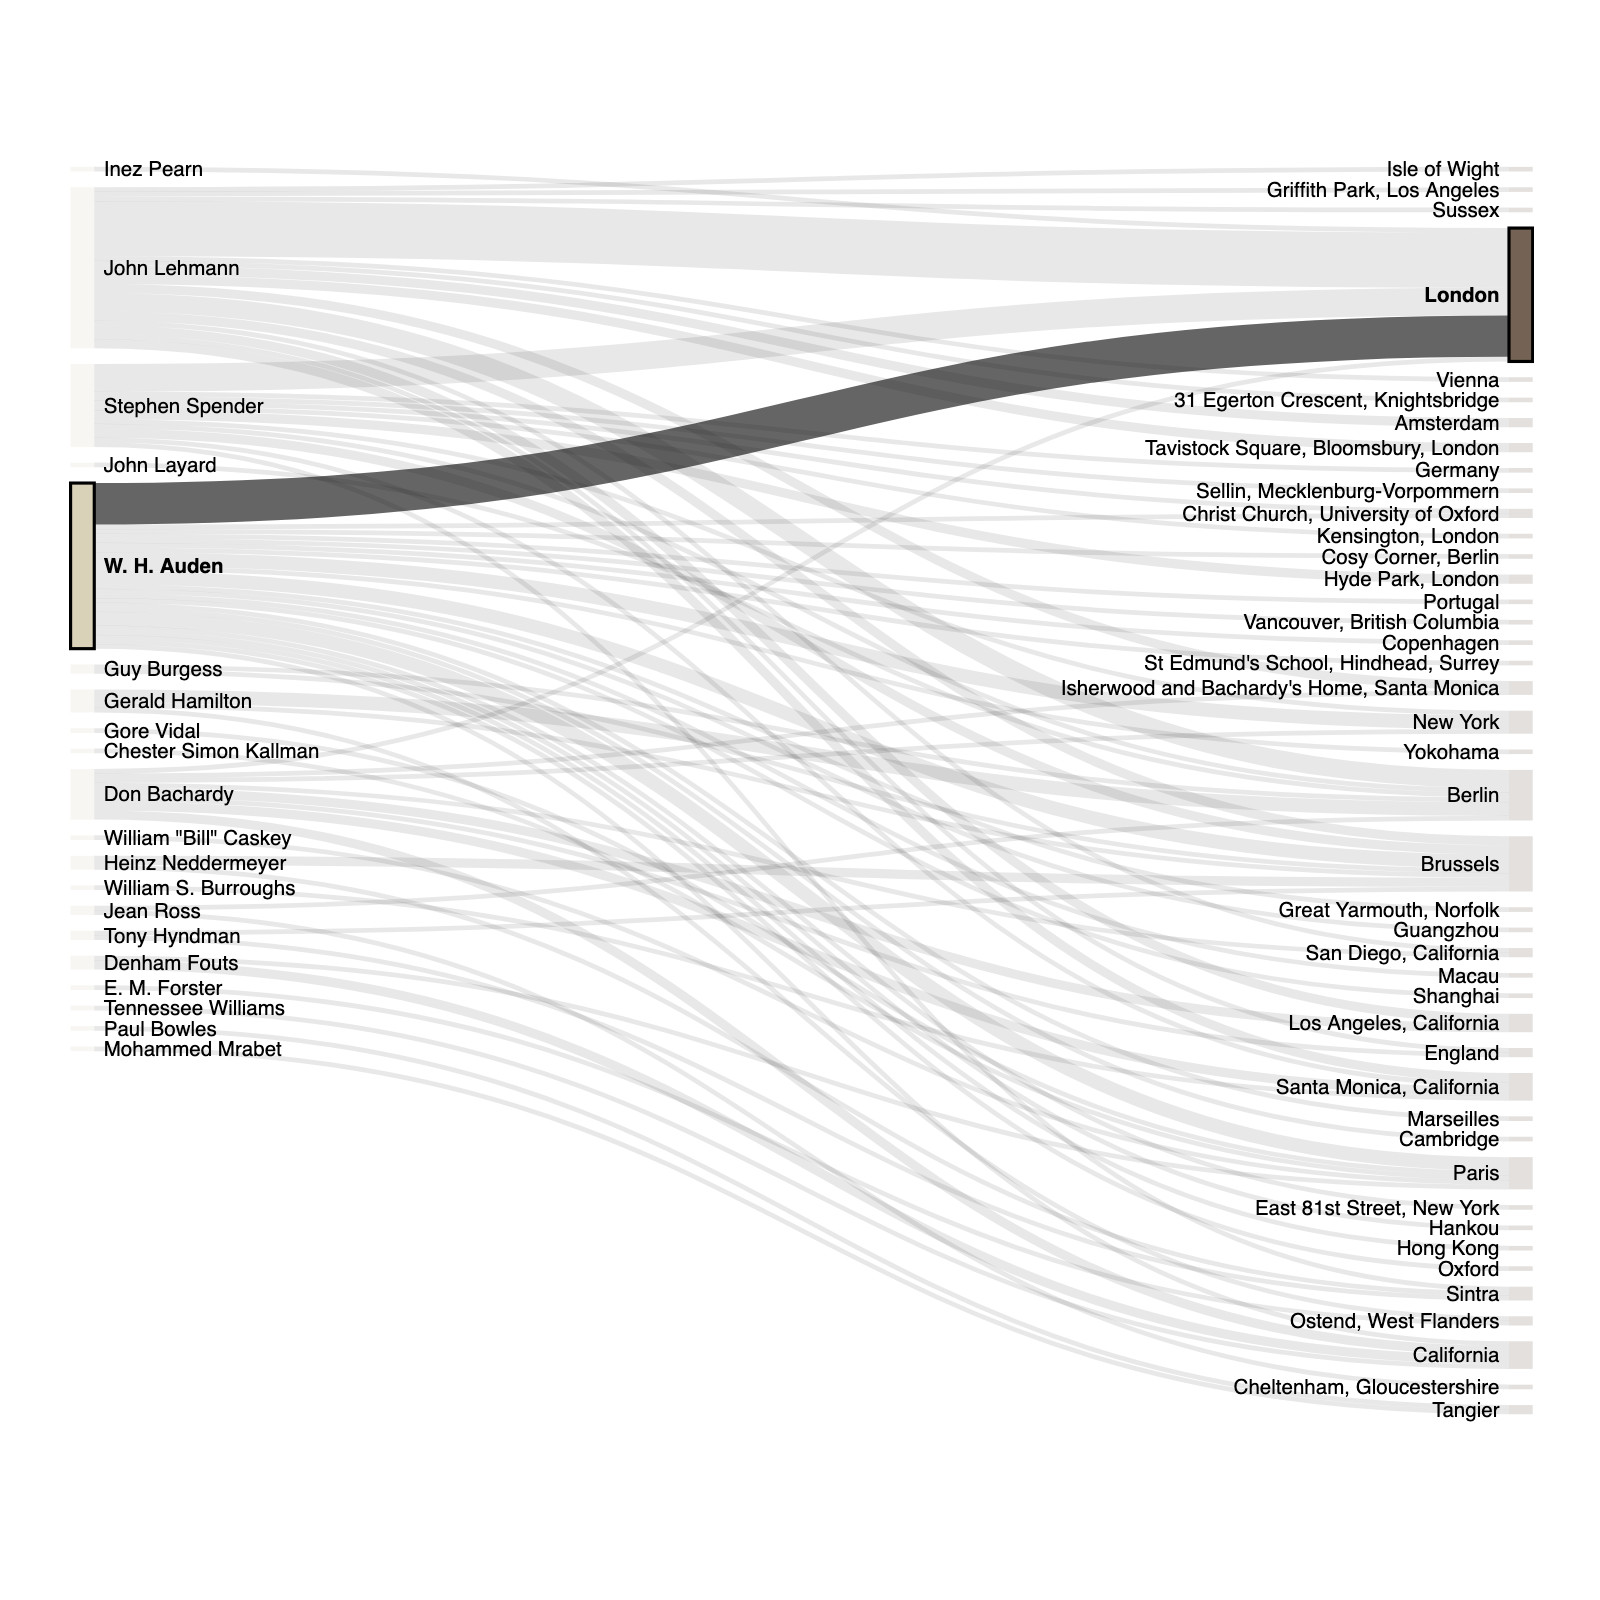
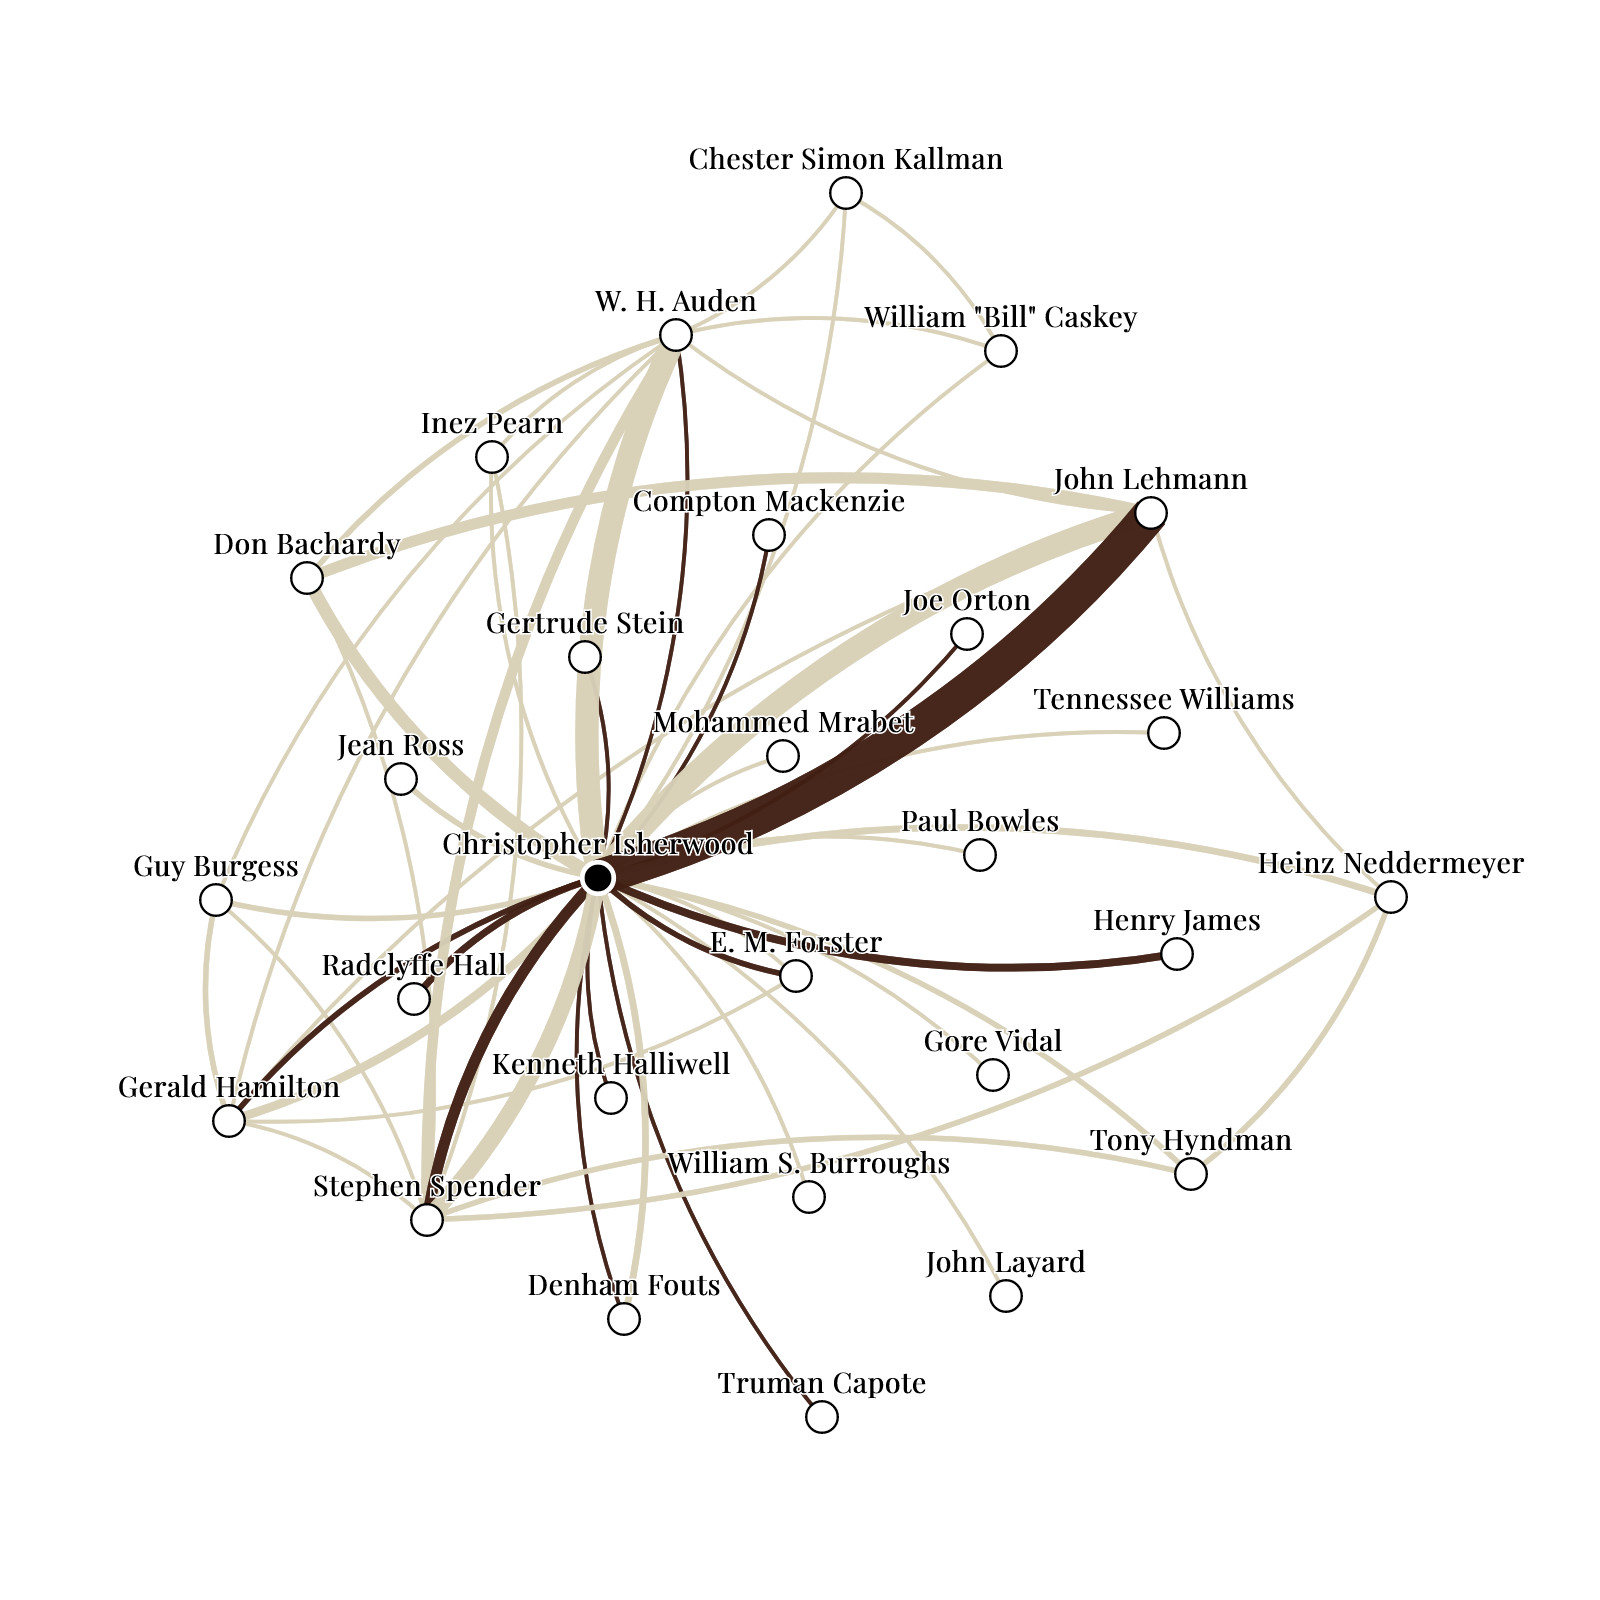
Collaborative project with researchers at the University of Innsbruck, aimed at designing a comprehensive network of connections among LGBT writers during the 20th century. The project involves various data visualizations and interactive dashboards, including maps, timelines, and network graphs. I am responsible for both the design and frontend development.
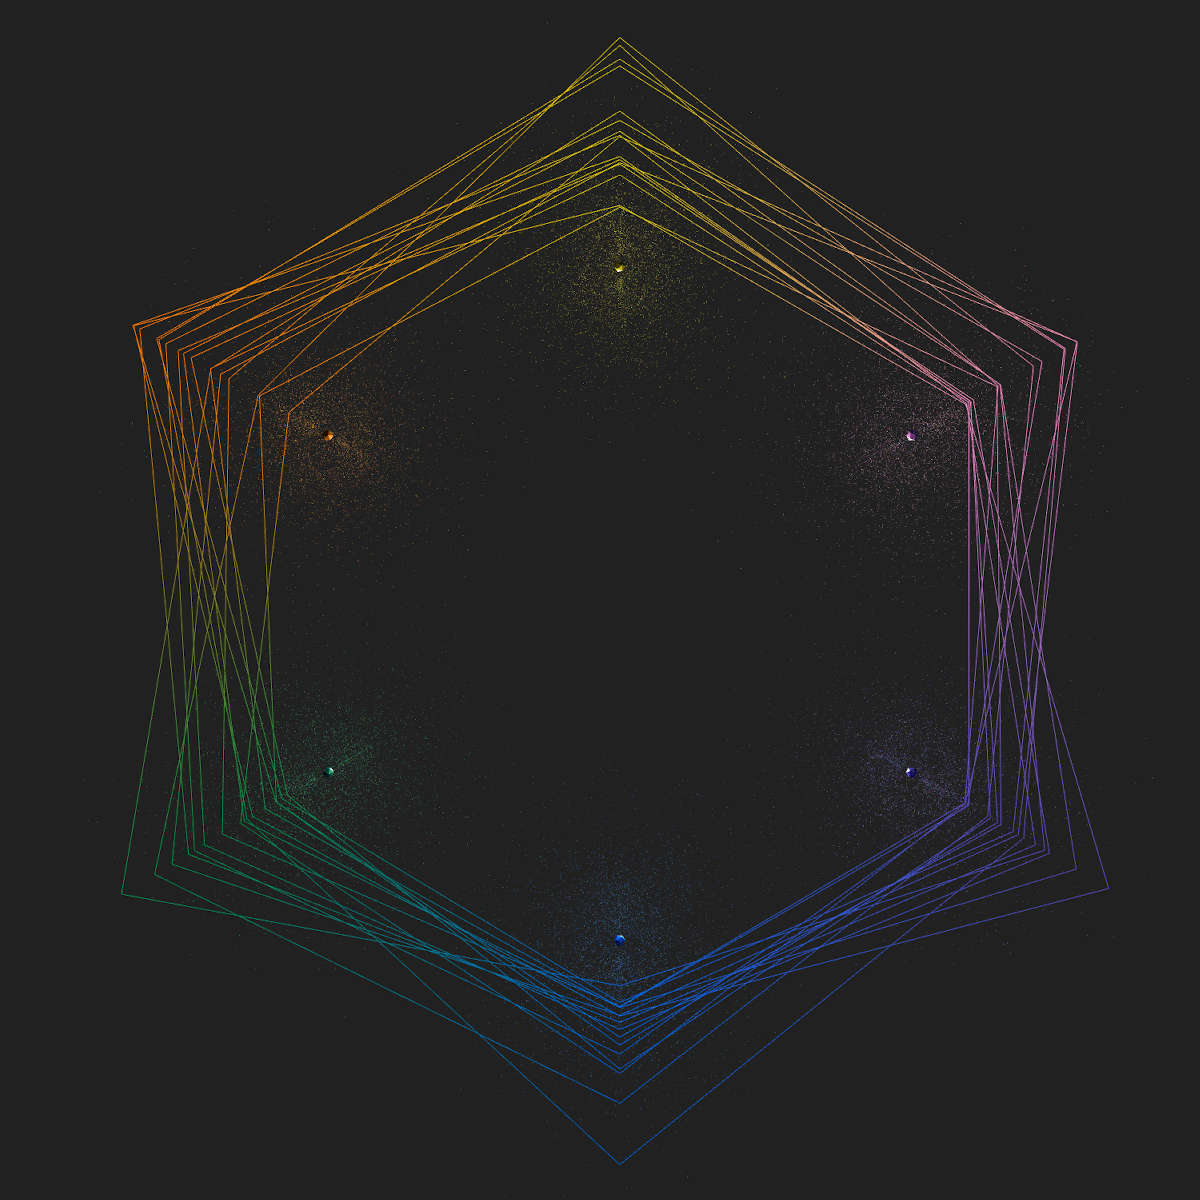
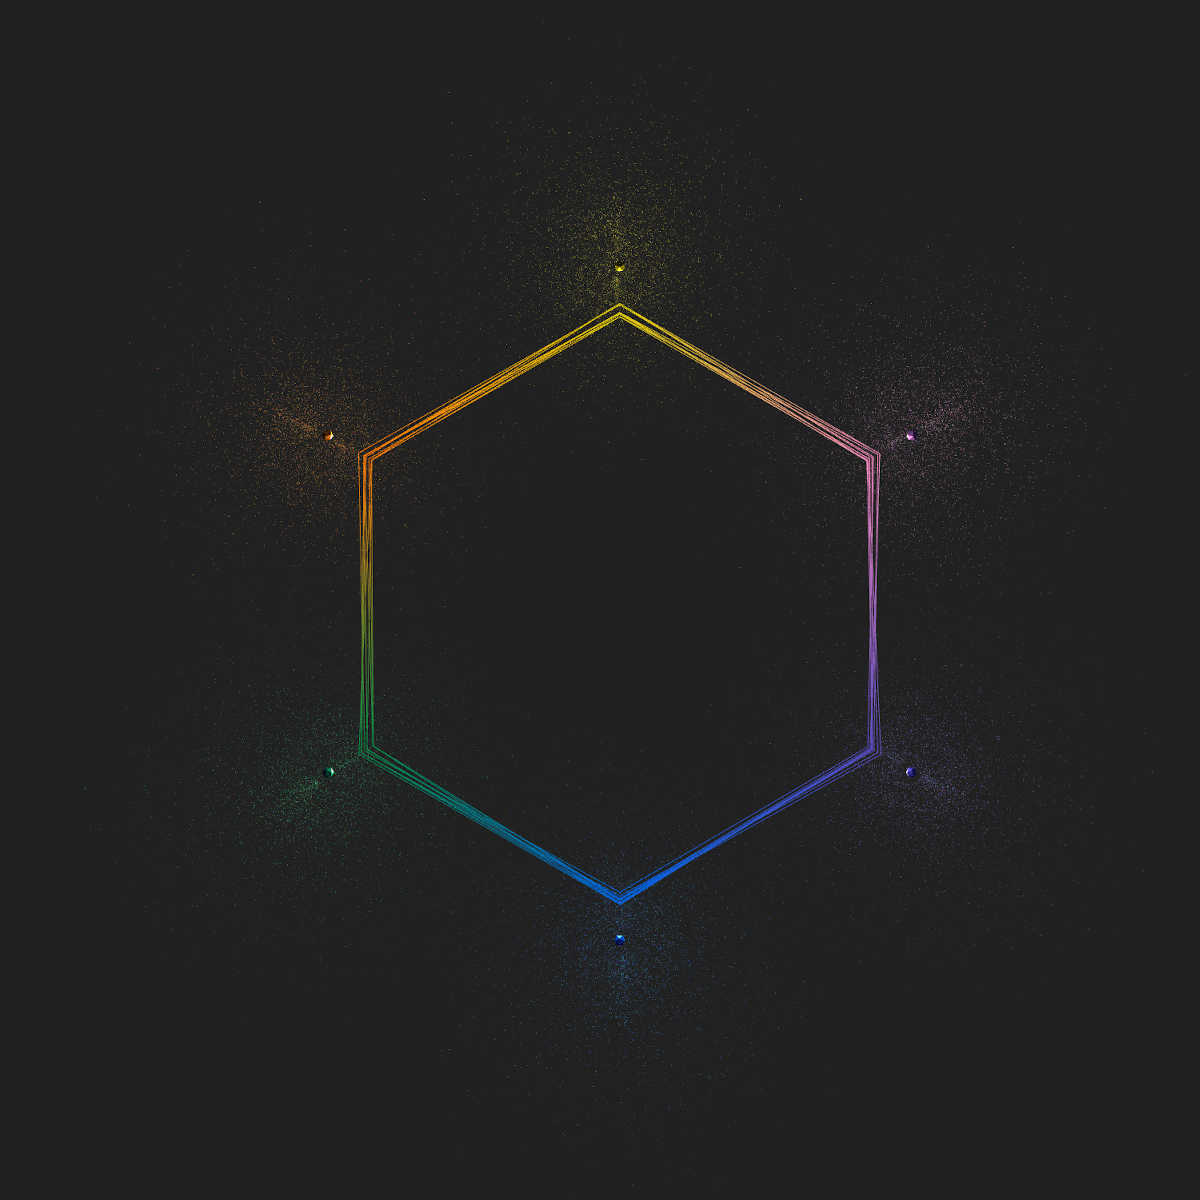
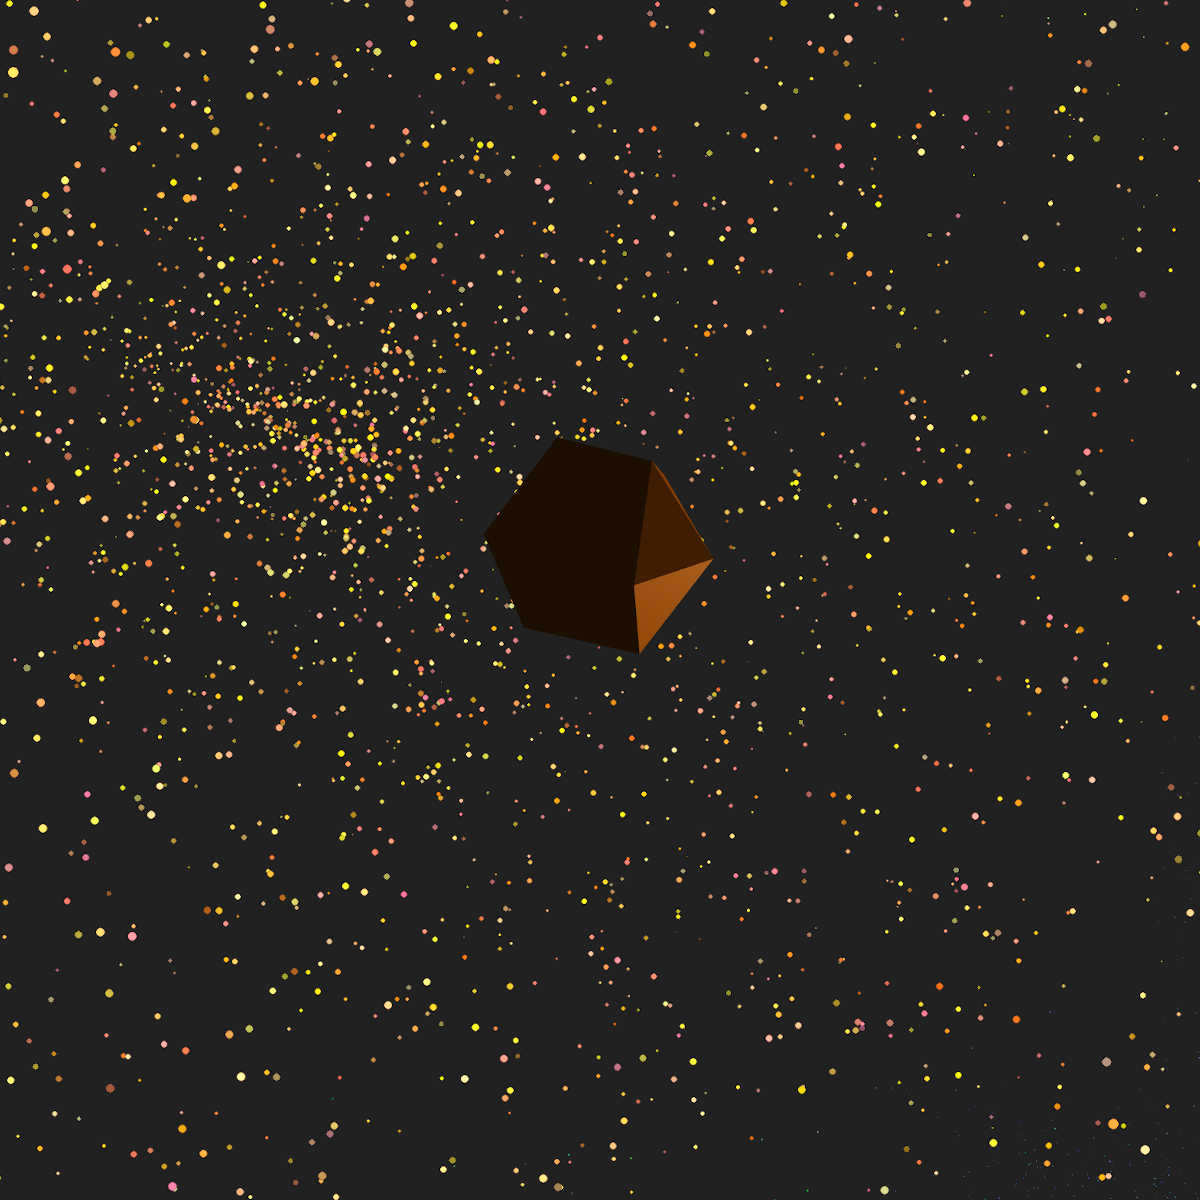
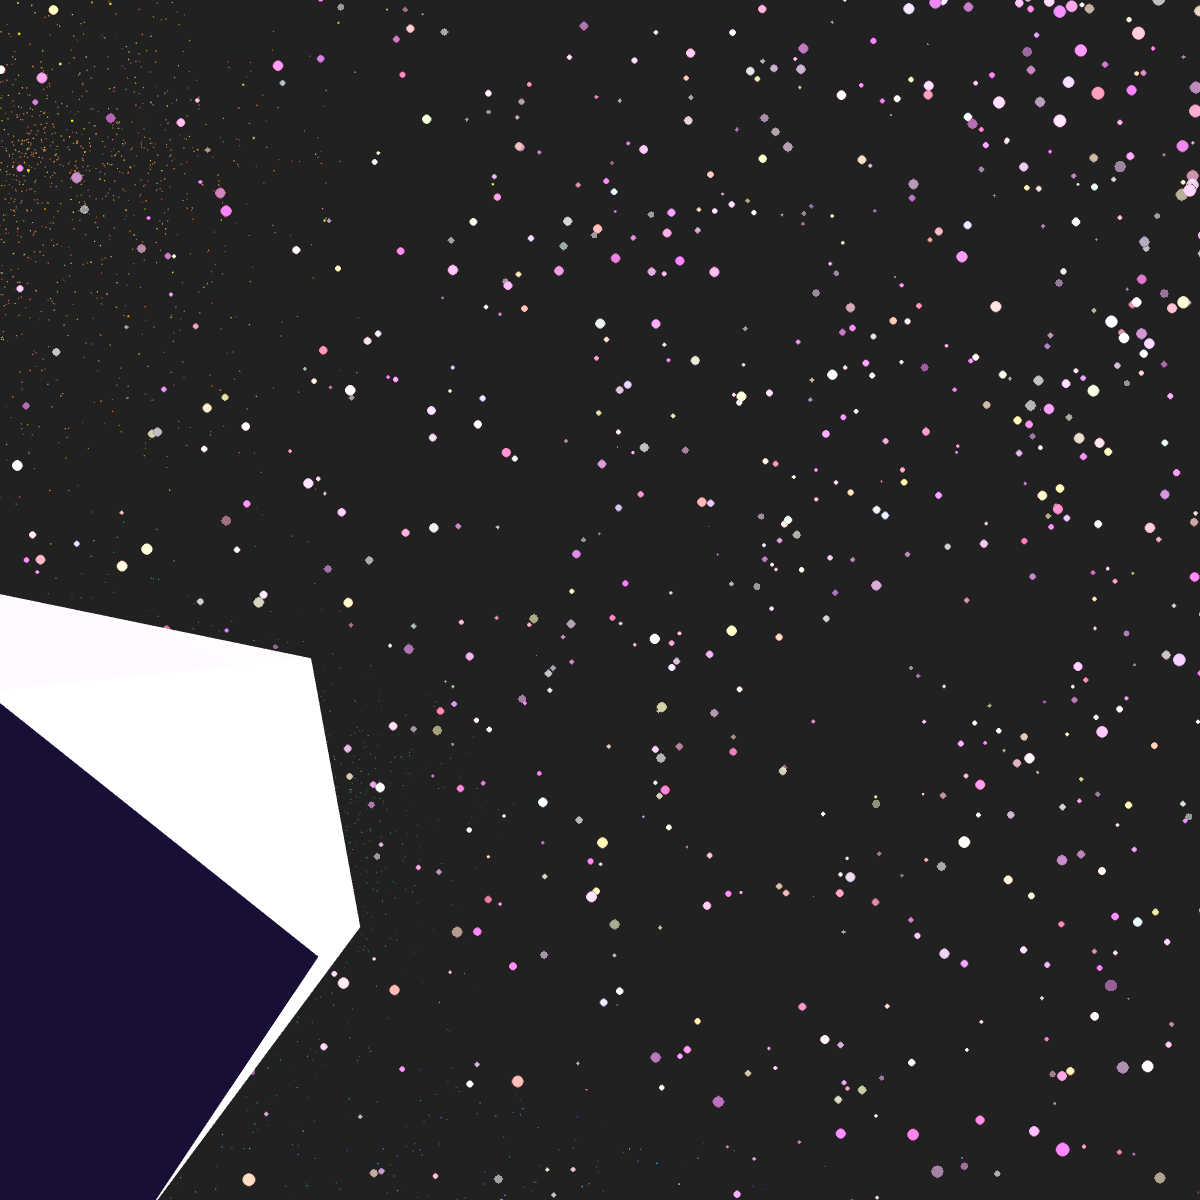
Design and development of an immersive visualization that showcases the portfolio of an NFT artist. The camera navigates through each corner of a hexagonal structure on scrolling, revealing different sections of the artist's work. The hexagonal structure can be customized by the user as desired.
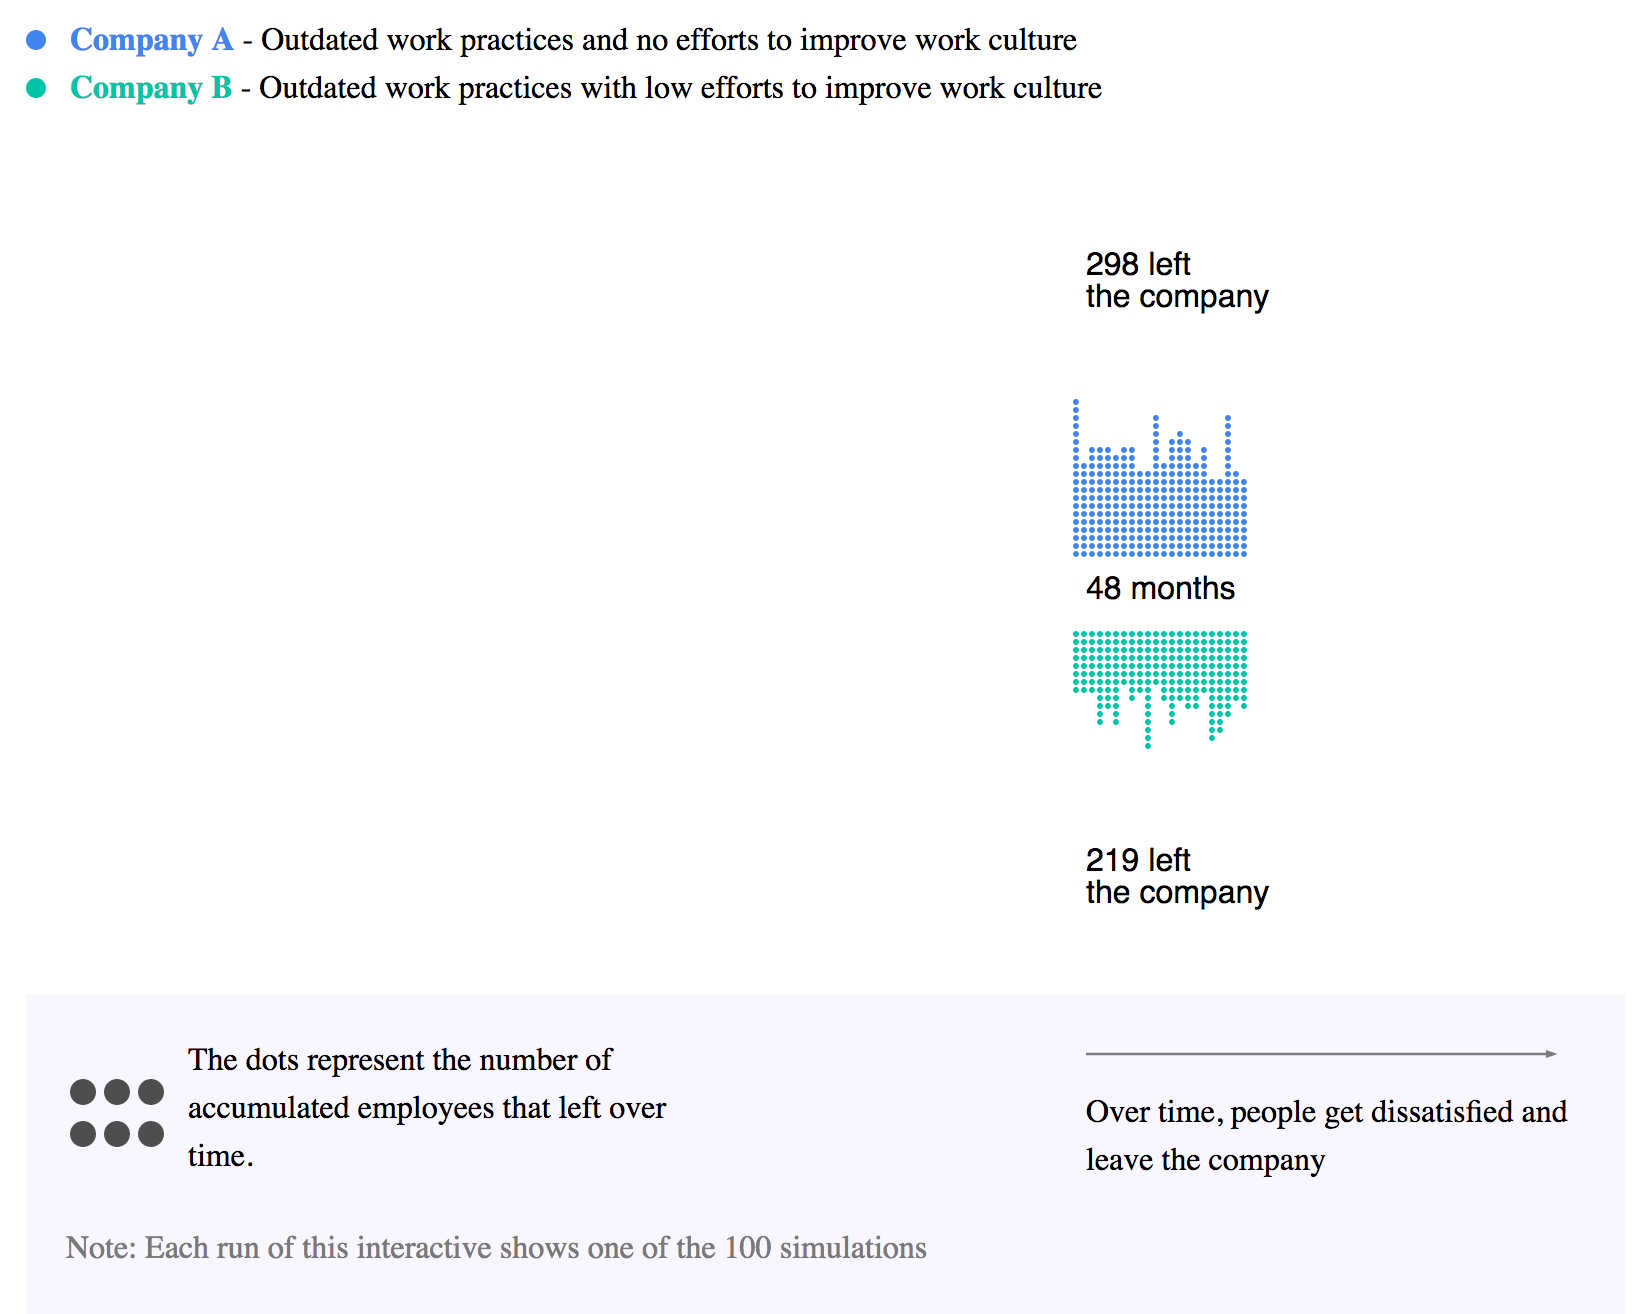
Design and development of a data visualization tool that displays simulated scenarios across the years. The visualization tracks the progress of two distinct groups of employees over time, allowing for a comparison of the impact of two different strategies. The project utilizes d3.js animations to provide insights to the user.