d3.js with 1,000 colors
d3.js is 10 years old! But what is d3.js? In one sentence, it's a javascript library to create interactive visualizations. In reality, it's much more. It has become a major tool to design customized dataviz.
I have selected the 1,000 most frequent colors used out of 40,000 visualizations built with d3.js.
Colors will be represented in 10 different ways with d3.js. Here in the background, each color is a dot randomly dispatched on screen. Start scrolling!
In this 1,000 colors set, let's get a sense of the most frequent ones. The bigger the bubble, the more frequent the color.
2/10
We can filter out to keep only the top 50 colors.
3/10
Here is another representation of our 1,000 colors, sorted by hue.
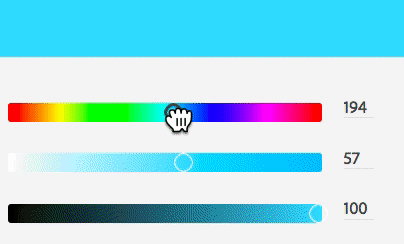
What is a color on a screen? You might be familiar with specific notations such as RGB, HEX, etc.
In this article, I'm using the HSL notation. Each color is represented by a vector of 3 numbers giving its hue, saturation, and lightness.
via color.adobe.com
4/10
We can assign a specific length to every color to represent the most frequent ones as we did earlier.
5/10
A more common way is to represent our values as a bar chart.
To sum up, our colors are ordered by hue value.
6/10
Now, this chart renders the same colors ordered by saturation instead of hue. Low saturated colors are on the left whereas highly saturated colors are on the right.
7/10
And here, our colors are ordered by lightness instead of saturation.
8/10
Let's make it as simple as possible. Back to our traditional bar chart, with the top 20 colors.
9/10
Happy anniversary d3.js!
Thank you to Mike Bostock and all the contributors for making this library so awesome, useful, and nice to use...
10/10