I recently launched an open-source project, On The Road: An Interactive Map of Jack Kerouac's journey. I traced the path in the book and documented all locations to create a visual representation. This article details the process of creating a "scrolly-telling" visualisation, making it easy to understand and useful for storytelling (e.g. migration flows, road trips).
d3.js to render the paths and leverage transitionsscrollama possibilities: reveal on scrollThe base code is available via an Observable Notebook.
1. Google My Maps (GMM) itinerary
I'm using the tool to get a specific itinerary using the add direction > driving route option. You can set up to 10 points per layer, and up to 10 layers. Once you're set with your itinerary, you can Export to KML/KMZ and follow the next step.
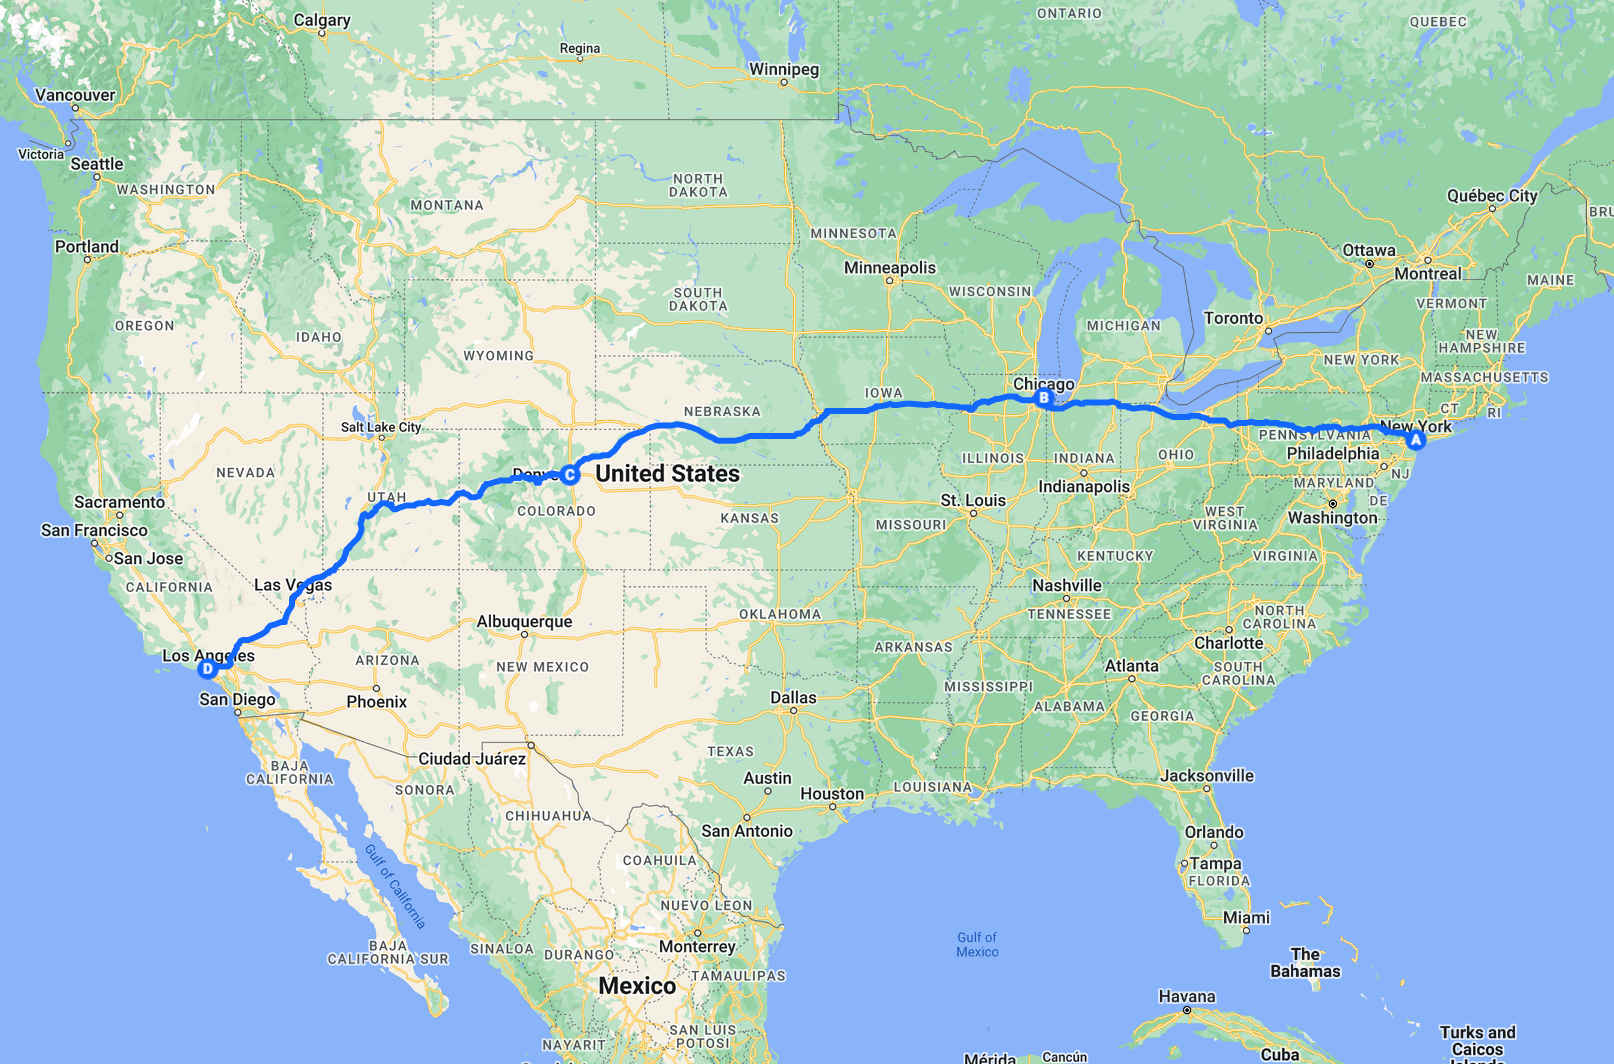
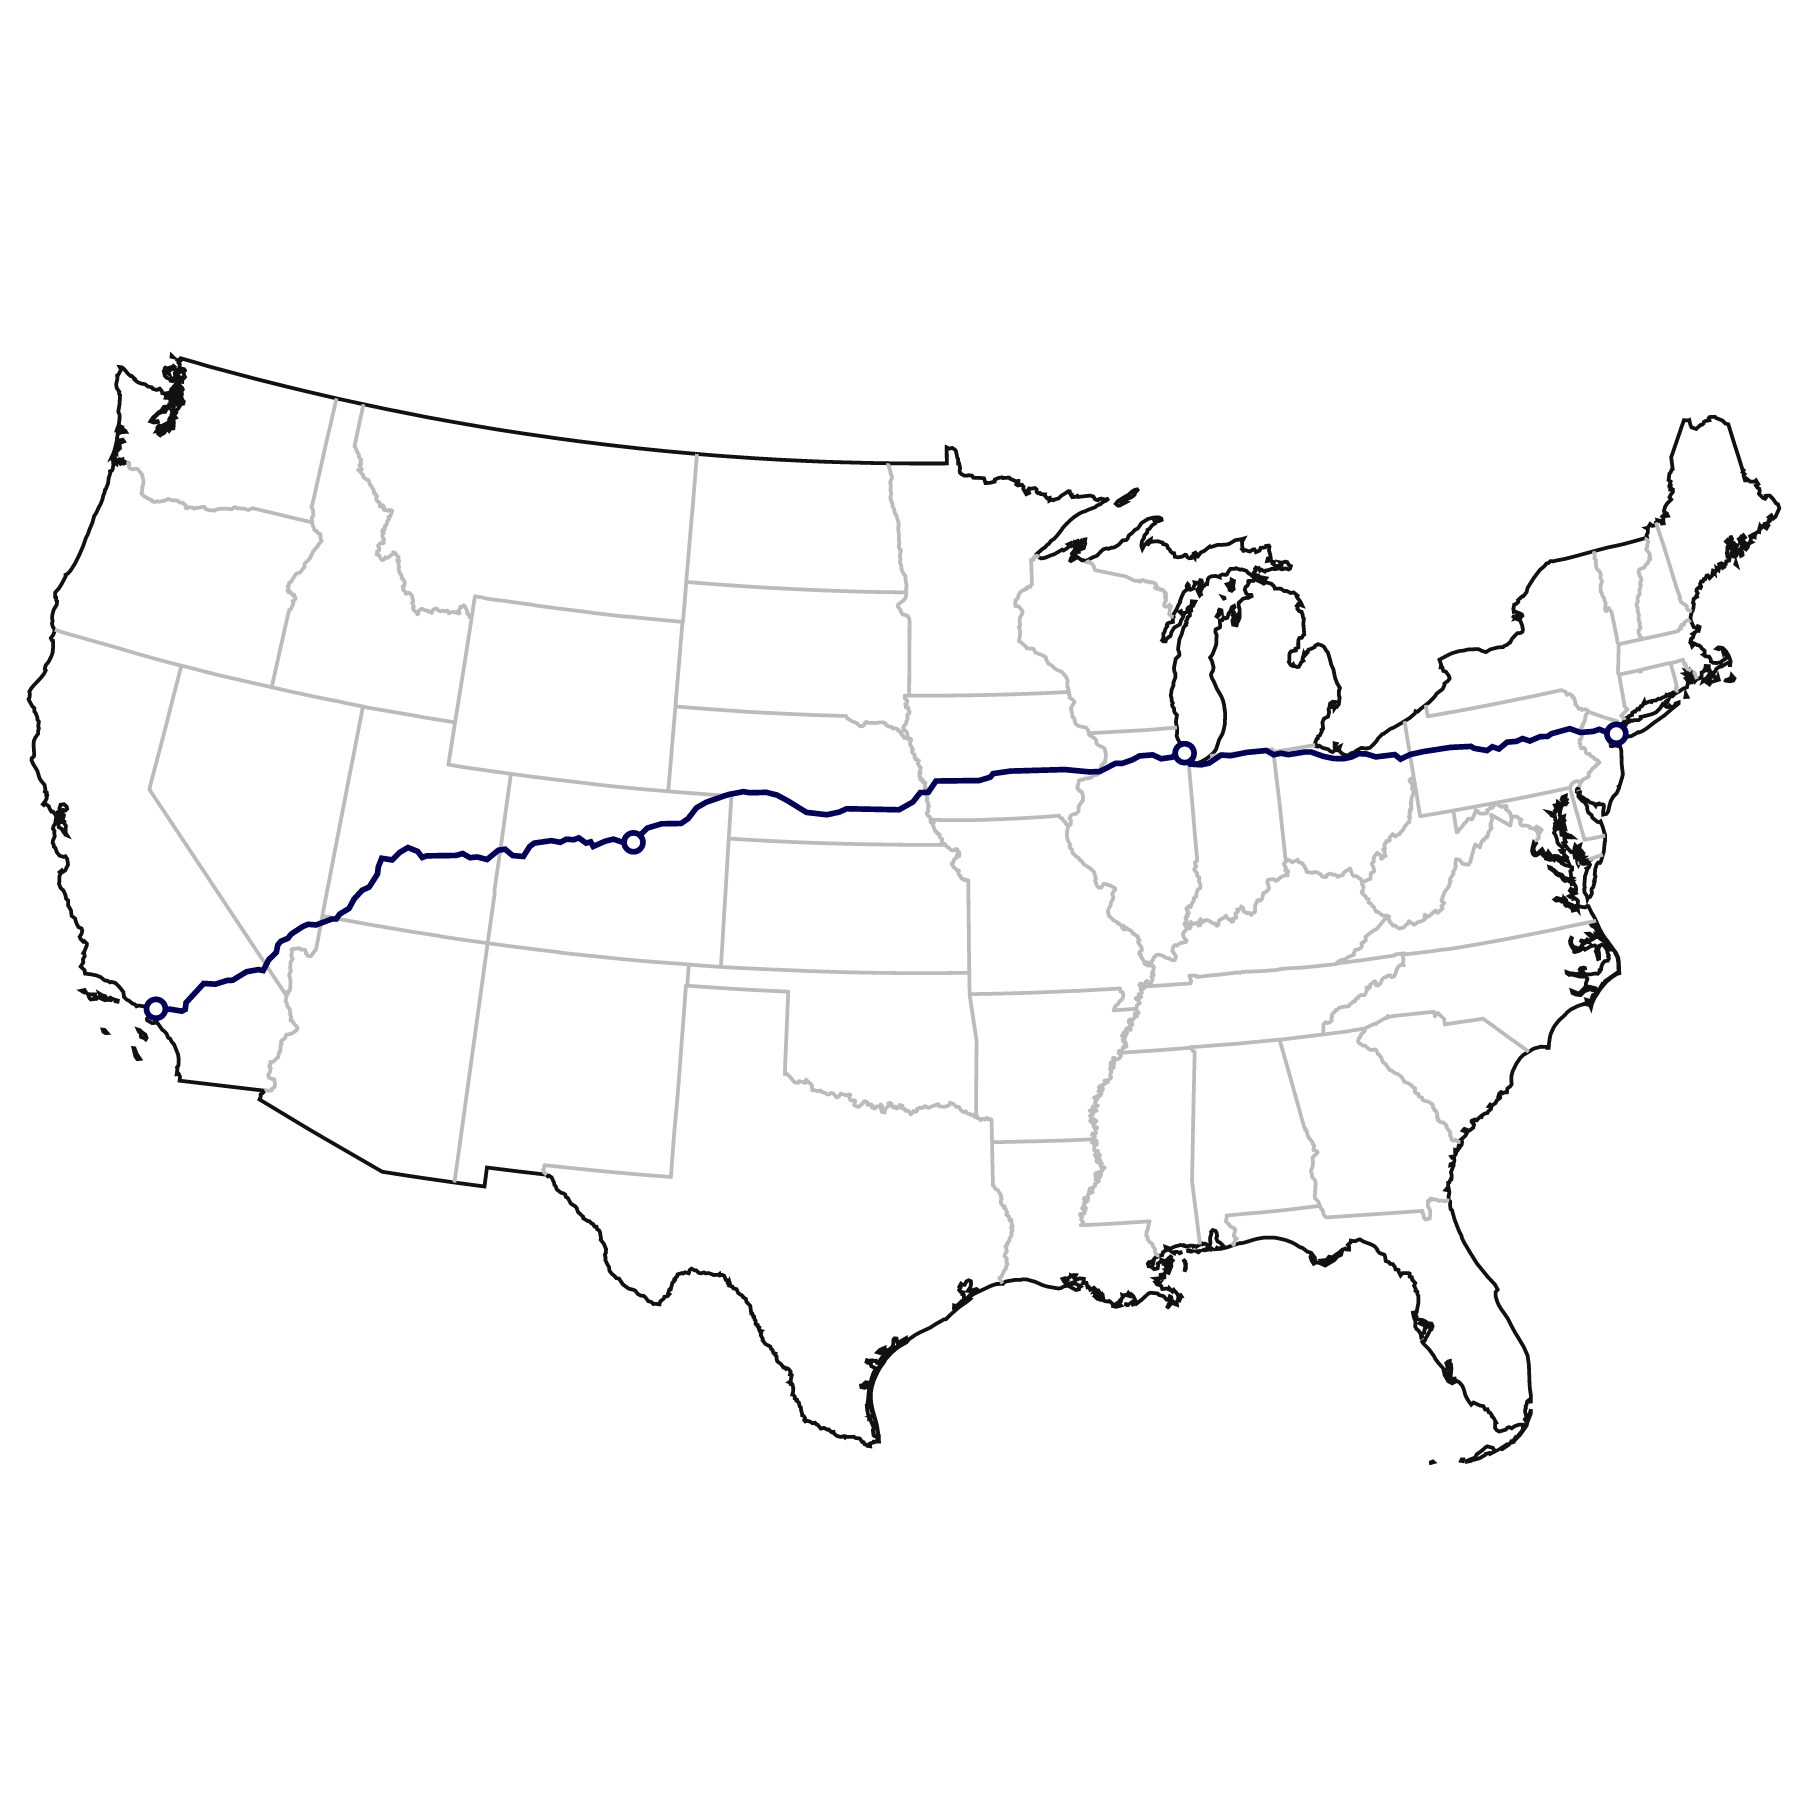
For the demonstration, I'm using this
GMM file, from NY to SF via Chicago and Denver.
The 4 maps I used for the On The Road project are
here and open to use.
2. Mapshaper to convert the format/simplify the path
With
Mapshaper
(among other tools, including the topojson library used in the code),
it is possible to manipulate geographical data easily: changing the format of a file, removing some parts of a state,
or even simplify a geometry.
Here, we will use it to simplify our path. In fact, the GMM extract is very accurate (several thousands of arcs/geometries to draw an accurate itinerary).
They are not all required for our visualization and Mapshaper helps simplify it down to a few hundreds.
We will then export the data as a Topojson-structured file, d3.js friendly. It requires two steps:
(1) Ready-to-be-simplified
First, I'm using the tool to convert my .kml file into a Geojson.
In Mapshaper, you can drag and drop the file extracted from GMM, and choose the Export option.
Select the Geojson format which will create a .zip file. Then, repeat by importing the newly created .zip file (geojson) and select the Simplify option. If
it works straight, you can simplify as in (2).
I've noticed that it is not always working straight ahead and the error thrown can be "This layer cannot be simplify".
If that happens, a solution is to export the newly created .zip as a Geojson (again), and use this new .zip file, now ready to get simplified.
(2) Simplify and export to Topojson-structured file
Choose a simplification level accordingly
(I'm leaving the default algorithms option but you can find an explanation in the
mapshaper repo).
In the following example, I simplified my path down to 1% and it still gives an accurate path.
Of course it depends on your use case. Once you chose the level, export the file as a Topojson and the output will be a .json file,
same as in the example.
3. d3.js to render the paths and leverage transitions
I recommend to follow along with the
Observable Notebook mentioned earlier, holding all the required js code.
I'm using the topojson package to read the data.
In my file, there is an object with all the points and another one with the paths.
If you are lost with the structure of the file, console.log() to the rescue! I let console.log(nyChDeLa) in the notebook code as an illustration.
We manipulate different objects here: us, points and roads. In the notebook, they are loaded as follow:
// loading the us
// this snippet originally comes from Mike Bostock's notebook "Walmart's Growth" https://observablehq.com/@mbostock/walmarts-growth
us = {
  const us = await d3.json("https://cdn.jsdelivr.net/npm/us-atlas@1/us/10m.json");
  us.objects.usSimplified = {
    type: "GeometryCollection",
    geometries: us.objects.states.geometries.filter(d => d.id !== "02" && d.id !== "15") // removing Hawaï and Alaska here
  };
  return us;
}
// loading the extract of the itinerary in a cell
nyChDeLa = FileAttachment("ny-la.json").json()// Getting points and roads with topojson
console.log(nyChDeLa); // how is the data structured?
const road = topojson.feature(nyChDeLa, nyChDeLa.objects["NY - LA1"]).features;
const points = topojson.feature(nyChDeLa, nyChDeLa.objects["NY - LA2"]).features;// 1. drawing the states
svg.append("path")
.datum(topojson.mesh(us, us.objects.usSimplified))
.attr("fill", "none")
.attr("stroke", "#bbb")
.attr("stroke-width", 2)
.attr("d", d3.geoPath());
// 2. drawing the nation on top with topojson.merge
// Interior borders shared by adjacent polygons are removed
svg.append("path")
.datum(topojson.merge(us, us.objects.usSimplified.geometries))
.attr("fill", "none")
.attr("stroke", "#111")
.attr("stroke-width", 2)
.attr("d", d3.geoPath());
// 3. Creating points
svg
.append('g')
.selectAll('circle')
.data(points)
.join("circle")
.attr("fill", "#fff")
.attr("stroke", "#000159")
.attr("stroke-width", 3)
.attr("r", 5)
.attr("transform", (d,i) => `translate(${projection(d.geometry.coordinates)})`)stroke-dasharray and stroke-dashoffset.
In both attribute, you set up the path length and in the transition,
you lower the path length of the stroke-dashoffset down to 0 to create the effect. Your path is revealed! svg
.append('g')
.selectAll('path')
.data(road)
.join("path")
.attr("stroke-dasharray", pathRoad.measure)
.attr("stroke-dashoffset", pathRoad.measure)
.attr("d", pathRoad)
.attr("id", "road-path")
.attr("fill", "transparent")
.attr("stroke-width", 3)
.attr("stroke", "#000159")
.transition()
.duration(10000)
.ease(d3.easeLinear)
.attr("stroke-dashoffset", 0)4. Scrollama to reveal the path on scrolls
I will briefly describe the process to reveal a path on scroll thanks to
Scrollama.
The idea is the same as above but instead of using a d3.js transition, we are using the Scrollama .onStepProgress() function to reveal the path.
Via a callback, we are able to get the progress value of an element (from 0 to 1) on scroll, depending on its position on the screen. When our element enters the screen, the value starts at 0. When leaving the screen,
the value ends at 1. By watching an element, we can assign the progress value to the stroke-dashoffset attribute of our path.
const scroller = scrollama();
scroller // setting-up the scroller
  .setup({
    step: ".step", // the step will be the html element we are watching
    progress: true
  })
  .onStepProgress((res) => {
    const p = res.progress; // getting the progress, a value between 0 and 1 depending pn where the .step element is on screen
    const rd = d3.select(`#road-path`); // getting the road based on its id
    const distance = rd.attr("stroke-dasharray"); // getting the full distance of the road
    rd.attr("stroke-dashoffset", (1-p) * distance ) // changing the offset of the path to reveal
  })
The whole set up requires to have both the element to watch and the map on screen. Map has to be a sticky element. The full process can be seen in action in the project On The Road and its whole code is open via its Github repository. Thanks for reading this far and I hope it will give some ideas for data visualization stories!