Lately, I have found some very inspiring 3D pieces, most of them combined with sound. I wanted to create some personal pieces (still work in progress) and share here some insights from my experience. With two basic examples ( Experience 1 and Experience 2 ) I explain the whole process from setting up the audio to retrieving the data and visualizing it. The code of the examples is on Github.
MeydaThree.js and shadersThe two songs are from Nicolas Jaar: America! I'm For The Birds (1) and Fight (2).
The website running the two examples uses the Nuxt 3 framework, on top of Vue. The
github repository
includes the whole website with pages and components folders.
I don't think it's a requirement to follow along as the process can be applied with any other framework or vanilla javascript.
1. Setting up the audio
The first step is to set up the audio. I am using the Web Audio API to get the audio data. I'm styling the page with an overlay
so that the music is played when the user click the "Enter" button. Note that in modern browsers by default, the audio can be played only
if the user clicks somewhere on the page.
<div>
  <div>
    <audio id="audio" controls loop>
      <source src="../public/sound/america.mp3" type="audio/mpeg">
    </audio>
  </div>
  <div id="overlay">
    <div @click="enter" class="enter-btn">
      Enter
    </div>
  </div>
</div>
enter() function is called, to play the song and hide the overlay.
function enter() {
  document.querySelector('#audio').play();
  document.querySelector('#overlay').style.display = 'none';
}
2. Retrieving the information with Meyda
The idea is to create a reactive object able to retrieve different audio features available with Meyda. Once created,
our object is made available to the rest of the application, including our Three.js scene. The Meyda
starter code is quite straitghforward.
Via a callback, we can retrieve the audio features. The audioFeatures object is then updated with the new values. I will explain
later which audio features I selected, and the arbitrary choices of frequencies. In my code, I set it
up as follow:
import * as Meyda from 'meyda';

// create a "signals" object as a state to hold the signals,
// available to the whole app, with 3 different audio features
// and the hardcoded size of the frequency array
const signals = useState('signals', () => {
  return {
    arrSize: 32, // number of lines drawned in the shader
    powerSpectrum: [], // audio feature as an array
    spectralRolloff: 0, // audio feature as a number
    energy: 0, // audio feature as a number
  }
});

// when the component is mounted, we create the Meyda analyzer
onMounted(() => {
  // we get the audio context via the Web Audio API
  const audioContext = new AudioContext();
  const htmlAudioElement = document.getElementById("audio");
  const source = audioContext.createMediaElementSource(htmlAudioElement);
  source.connect(audioContext.destination);

  // we create the analyser
  const analyzer = Meyda.createMeydaAnalyzer({
    audioContext: audioContext,
    source: source,
    // we limit the number of frequencies to the minimum, 256 here, default is 512
    bufferSize: Math.pow(2, 8),
    // our 3 audio features
    featureExtractors: ["powerSpectrum", "energy", "spectralRolloff"],
    // we set up a callback to update the signals object
    callback: (features) => {
      signals.value.spectralRolloff = features.spectralRolloff;
      signals.value.energy = features.energy;
      // filter the powerSpectrum array to match the number of lines drawned in the shader
      signals.value.powerSpectrum = features.powerSpectrum.filter((_, i) => i % 4 === 0);
    },
  });
  analyzer.start();
});
signals object is now available to the rest of the application. In the next step, we will use it to create our Three.js scene.
3. Choosing the audio features
The Meyda library offers a wide range of audio features. My best recommendation for newcomers is to try them all and see what works best for your visualization and sound. As I'm quite new to the topic, I will not give any advice on which audio features to choose. But from the tests I ran, here are some points to keep in mind.
powerSpectrum is between 0 and 1, while the energy is between 0 and 1000. Some data have to be normalized,
and clamped to avoid the "epilepsia" effect.
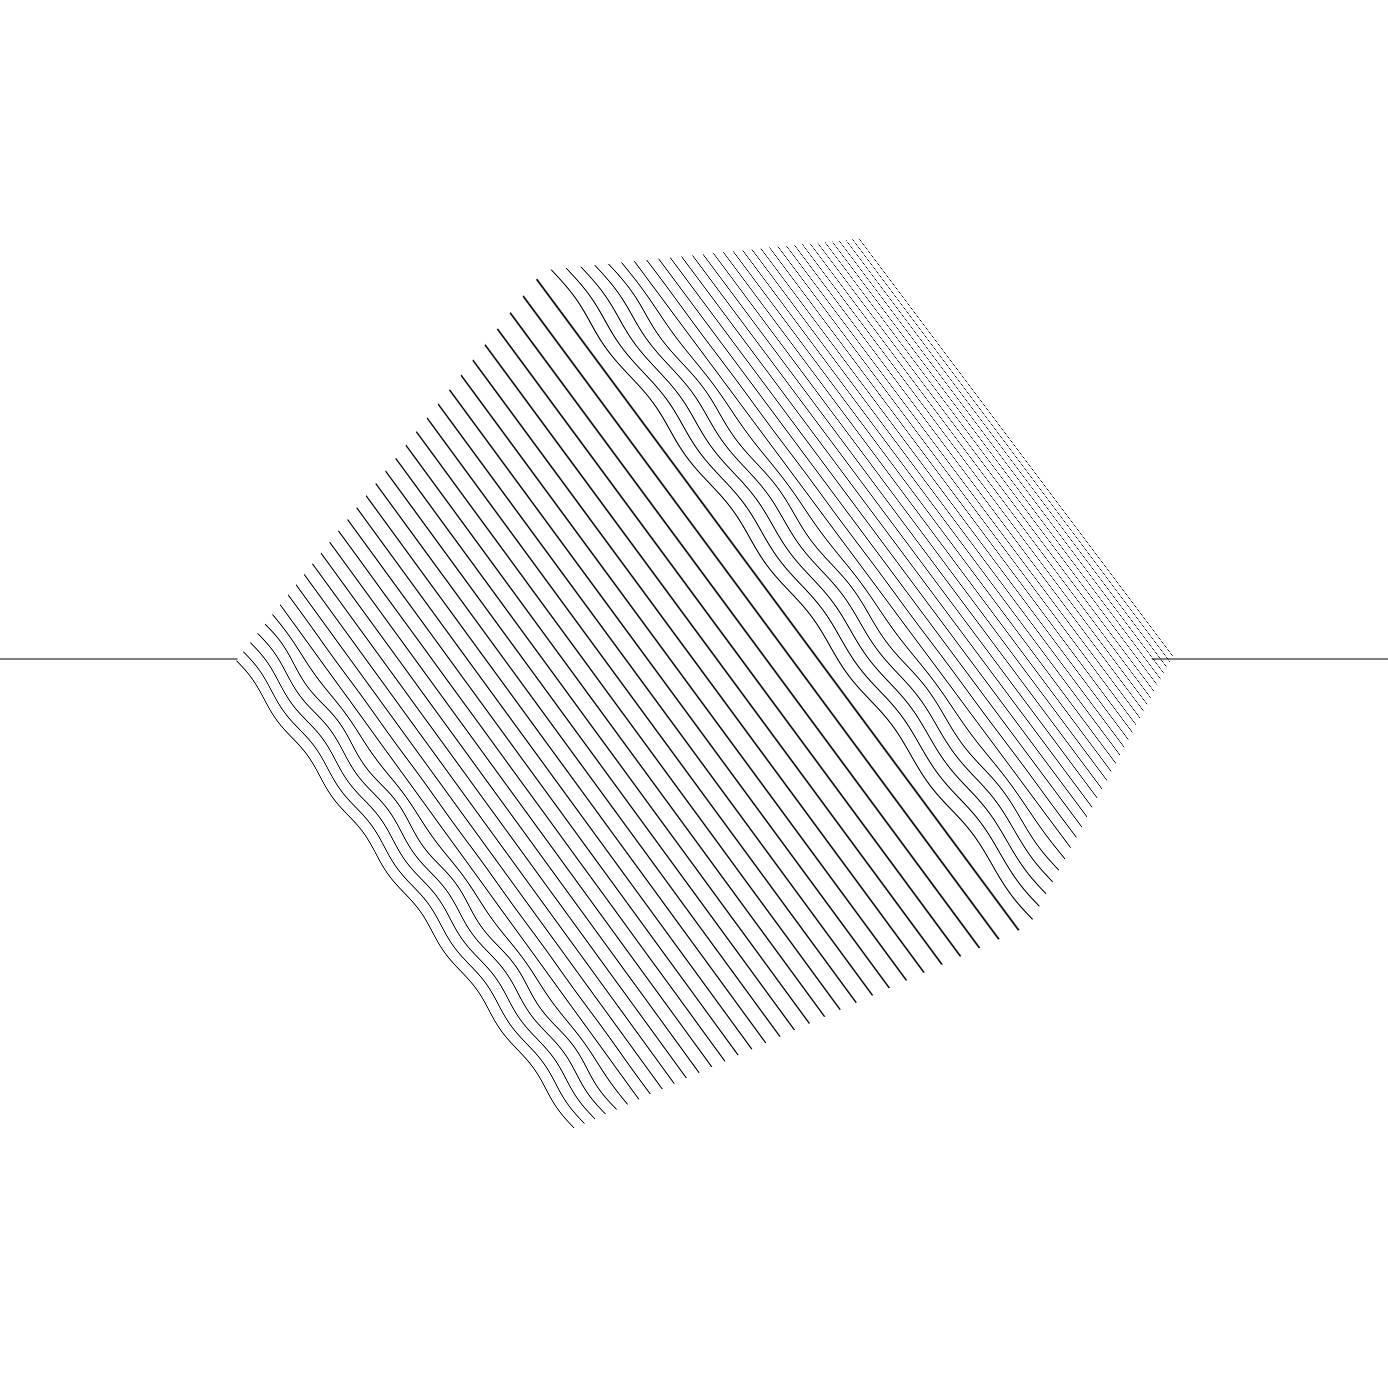
4. Visualizing signals with Three.js and shaders
As we have an object storing all the required data (in the first example, the power spectrum, the energy and the roll-off frequency), we can use these dimensions
to visualize the signal. I decide for the first example to render the energy as the size of the cube (capturing the beat of the song),
the roll-off frequency as scaled line (I'm not convinced about that one but I plan to try it out with iterations),
and the power spectrum as a set of lines (capturing 32 frequencies). Here is what it looks like in Three.js:
The energy and the roll-off frequency are represented by a single dimension (scale of the cube and scale of the line), while the power spectrum is represented by an array of data in the shader.
Here, I create the line.
// create a line to capture the spectralRolloff signal
const geometryLine = new THREE.BufferGeometry();
const arrSizeLine = 100;
const positions = new Float32Array(arrSizeLine * 3);
for (let i = 0; i < arrSizeLine; i++) {
  positions[i * 3] = i / arrSizeLine;
  positions[i * 3 + 1] = 0;
  positions[i * 3 + 2] = 0;
}
geometryLine.setAttribute('position', new THREE.BufferAttribute(positions, 3));
const materialLine = new THREE.LineBasicMaterial({ color: 0x000000 });
line = new THREE.Line(geometryLine, materialLine);
scene.add(line);
signals object: signals.value.spectralRolloff.
// line size
const lineFactor = signals.value.spectralRolloff / 1100;
line.scale.set(lineFactor, lineFactor, lineFactor);
line.position.set(-lineFactor/2, 0, 0); // center the line
To capture the other two signals, I create a cube (which size will be updated) along with a shader material. The shader material will be customized with 32 lines, whose shape will be influenced by the array of frequencies. Prior knowledge to shaders might be required for the customization: I'm updating the
uniforms in the render() loop.// create a cube to capture the energy signal and the powerSpectrum signal
const geometryCube = new THREE.BoxGeometry(1,1,1);
// create the shader material for the cube
// reminder: getting the array size as a number is required to create our array in the shader
const arrSize = signals.value.arrSize;
const materialCube = new THREE.ShaderMaterial({
uniforms: {
time: { value: 0 },
fArray: { value: new Float32Array(arrSize) }, // array of frequencies as a uniform, updated in the render loop
},
vertexShader: `
varying vec2 vUv;
void main() {
vec3 pos = position;
vUv = uv;
gl_Position = projectionMatrix * modelViewMatrix * vec4(pos, 1.0);
}
`,
fragmentShader: `
uniform float time;
uniform float fArray[${arrSize}]; // getting the array size as a number is required to create our array in the shader
float plot(vec2 st, float pct){
return smoothstep( pct-0.08, pct, st.y) -
smoothstep( pct, pct+0.08, st.y);
}
varying vec2 vUv;
void main() {
vec2 st = vUv;
vec2 store = vUv;
float size = float(${arrSize});
st.y = fract(st.y * size); // fragmenting the y coordinate to get 32 lines
// our line is a sine wave, whose amplitude is influenced by the array of frequencies
// I experimented abit too mush here, this is up to you to clamp the data/tweak the factors
float y = sin(st.x * 4. * 3.14 * 3. + time * 8.) * clamp(abs( fArray[ int(floor(store.y * size)) ] * 5000. ), 0., 1500.) * 0.0005 * 8. / 30. + 0.5;
float pct = plot(st,y);
vec3 color = vec3(1.);
color = (1.0 - pct) * color + pct * vec3(0.);
gl_FragColor = vec4(color, 1.);
}
`,
});
cube = new THREE.Mesh(geometryCube, materialCube);
scene.add(cube);
And in our render loop, we update the size of the cube along with the uniform storing our array for the power spectrum.
// update mesh size
cube.scale.x = signals.value.energy * 0.01 + 2.3 ;
cube.scale.y = signals.value.energy * 0.01 + 2.3 ;
cube.scale.z = signals.value.energy * 0.01 + 2.3 ;

// update uniforms
cube.material.uniforms.fArray.value = signals.value.powerSpectrum;
We now have a cube that is influenced by the energy and the power spectrum, and a line capturing the roll-off frequency. The
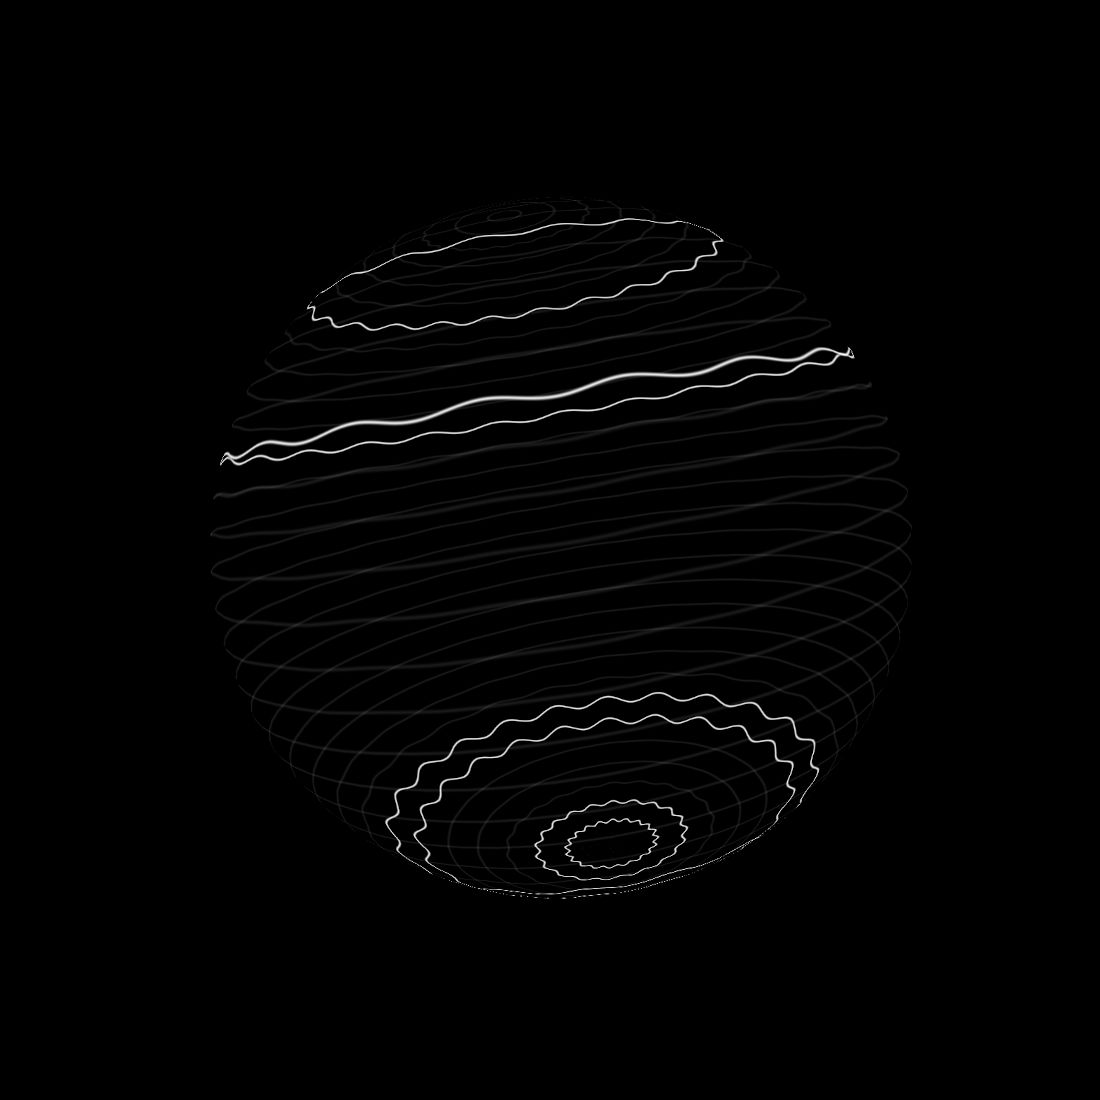
second example is even simpler as it captures only the power spectrum.
These experiments are part of a upcoming project, more to come soon!