This article aims at exploring different tecnics to visualize many data points on a web page.
We are exploring web and software tecnics to visualize data.
Although interesting, we will not explore or explain our dataset here.
I hope this article can help people into data visualization, who may have faced the challenge to draw a lot of points in the browser.
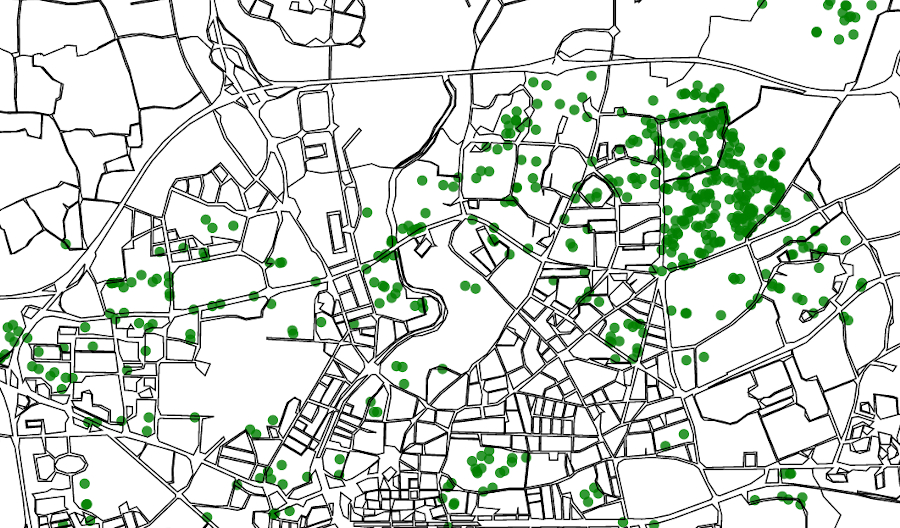
SVGCanvasQGIS1. Drawing 1,000 trees in SVG
You probably heard of svg if you have already built interactive visualizations on the web.
It means Scalable Vector Graphic and it is probably the most common way to visualize data and handle interactive event at the same time.
It makes it convenient to display tooltips on hover, to design transitions and other kind of interactivity. d3.js, one of the most popular library to design interactive visualizations leverages SVG (among other format) to build graphics.
On top of this, SVG does not lose its quality when it is rescalled. This additional reason makes it useful in web design in general.
When working with SVG, we are adding HTML elements to the page: every group, text, rectangle or circle is added to the source code. Although really convenient to interact, it will make the browser experience sluggish when drawing too many objects (over +1000 is not recommended). With much less computational power, the mobile experience will be even more diminished.
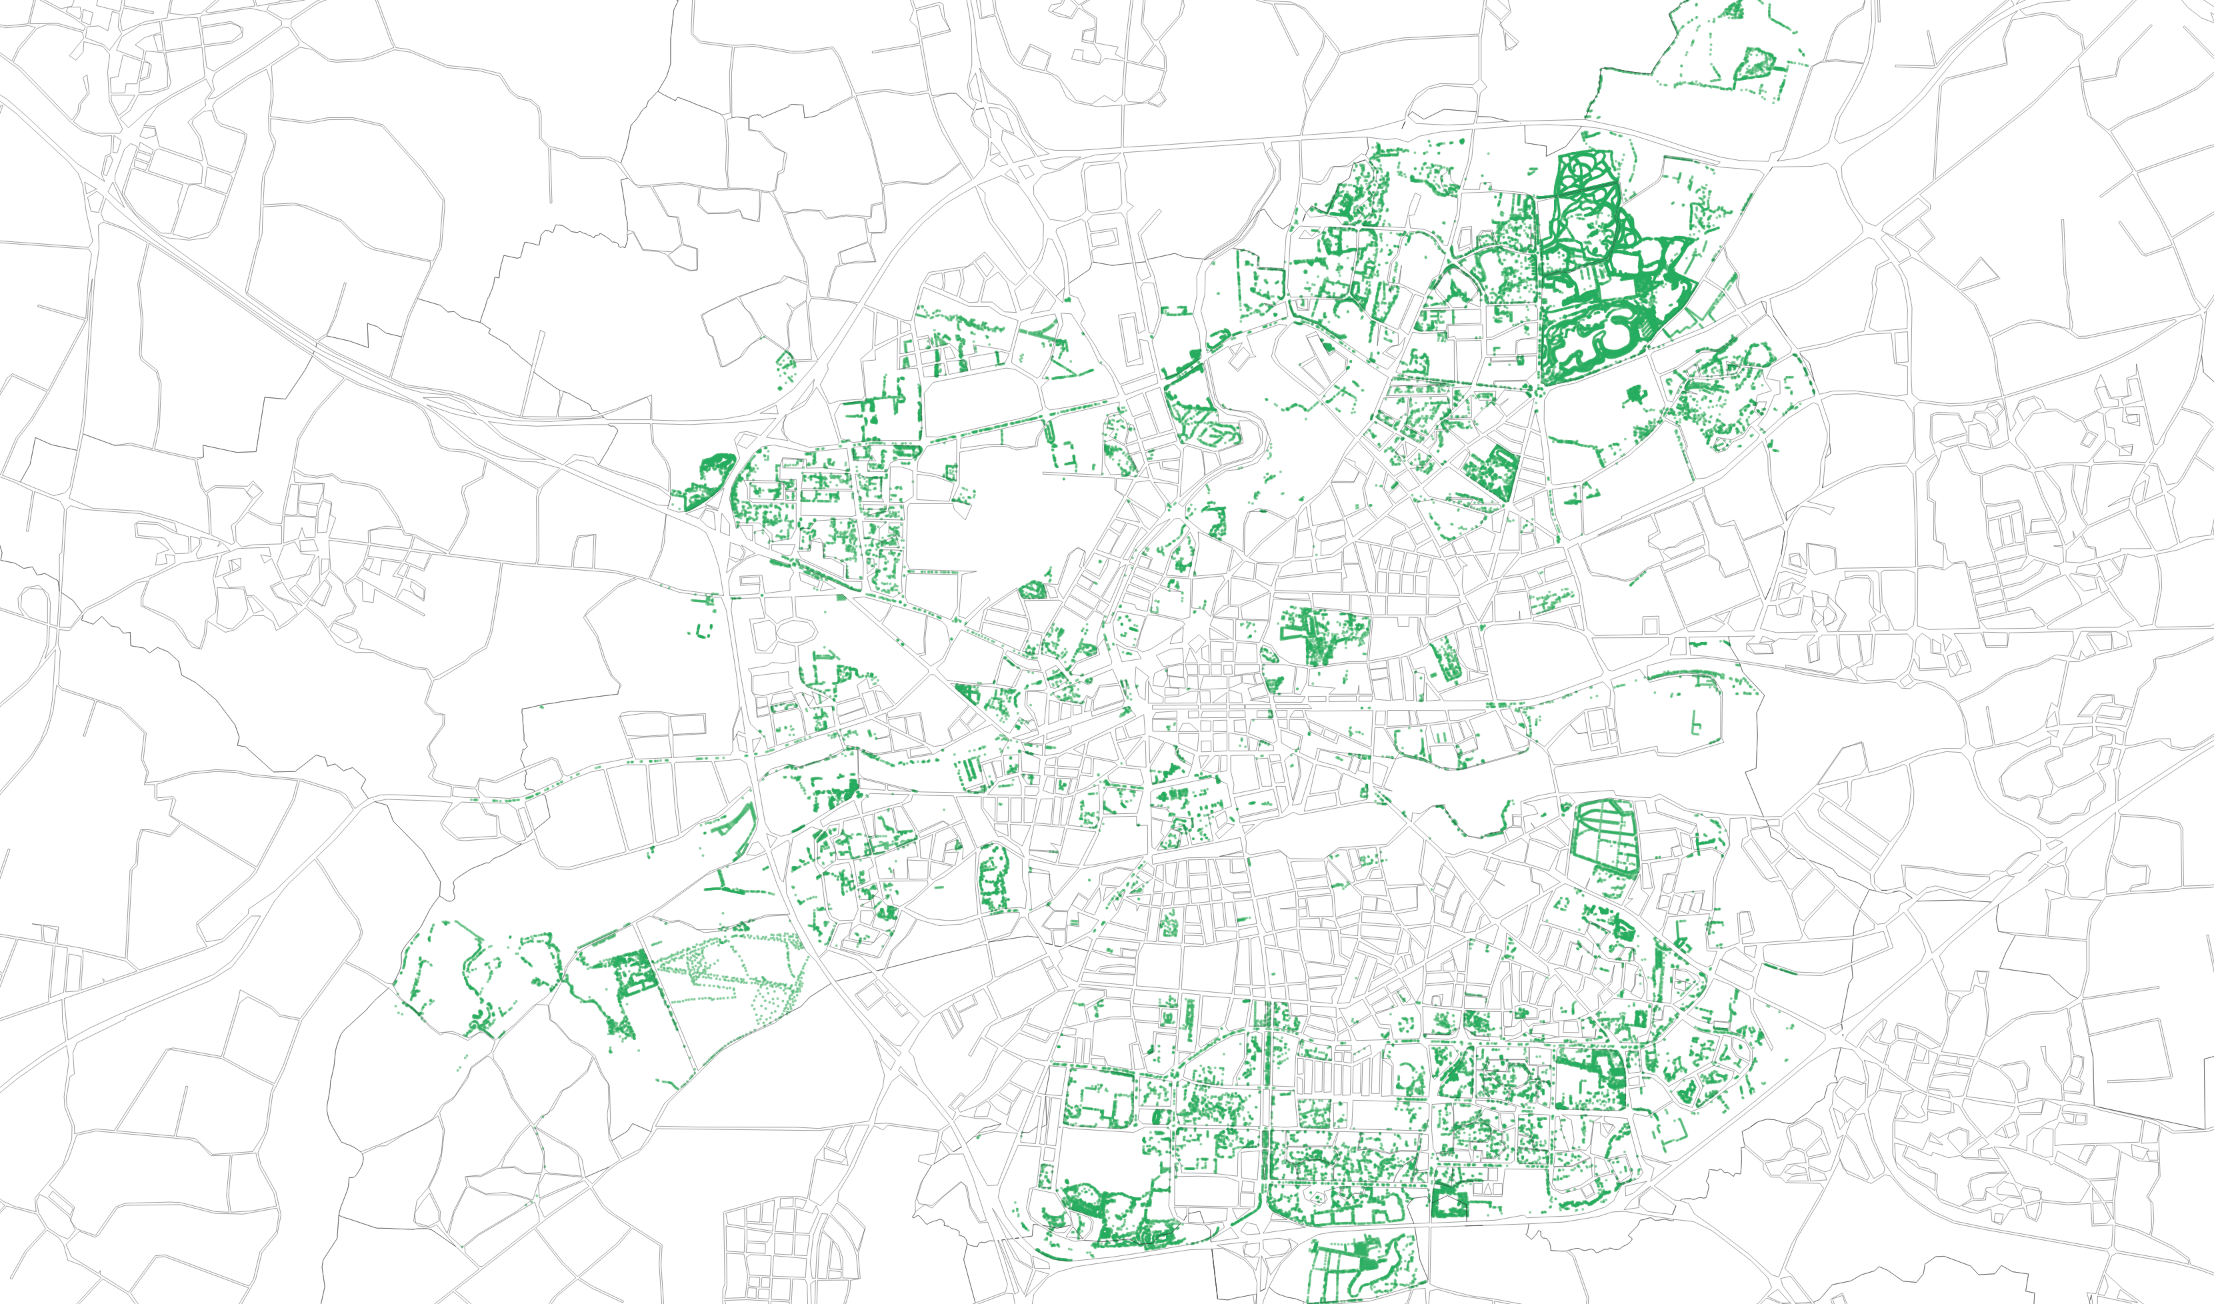
2. Drawing 68,000 trees in Canvas
What if you want to draw way more points on your chart? SVG will not be the proper tool, for the reasons we mentioned earlier.
Instead, you might try to generate one static element which will quickly render on your page, without adding any other elements.
That's what HTML5 canvas does.
The approach is different: with SVG, you add elements on the page, and you interact with them. With Canvas, you give directives in javascript to draw pixels on your page. The result is only one element, the Canvas, and nothing else. Adding interactions is not as straightforward as it is for SVG. Although not impossible, it can be a bit cumbersome and the way to do it is completely different. You actually need to assign a specific rendering to your pixels.
3. Drawing 2,000,000 trees in QGIS
We haven't mentioned yet the size of our dataset. Most of the time, you load your data as a file (.csv, .json, etc.) from your server or directly via external APIs.
No matter where the data is located, it requires some loading time, depending on the size of your dataset.
The bigger the dataset, the longer the time.
Your end users will have to wait, depending on their connection speed.
Of course, you can think of some nice ways to make your end users wait: loading bars, additional content prior to your visualization and so on.
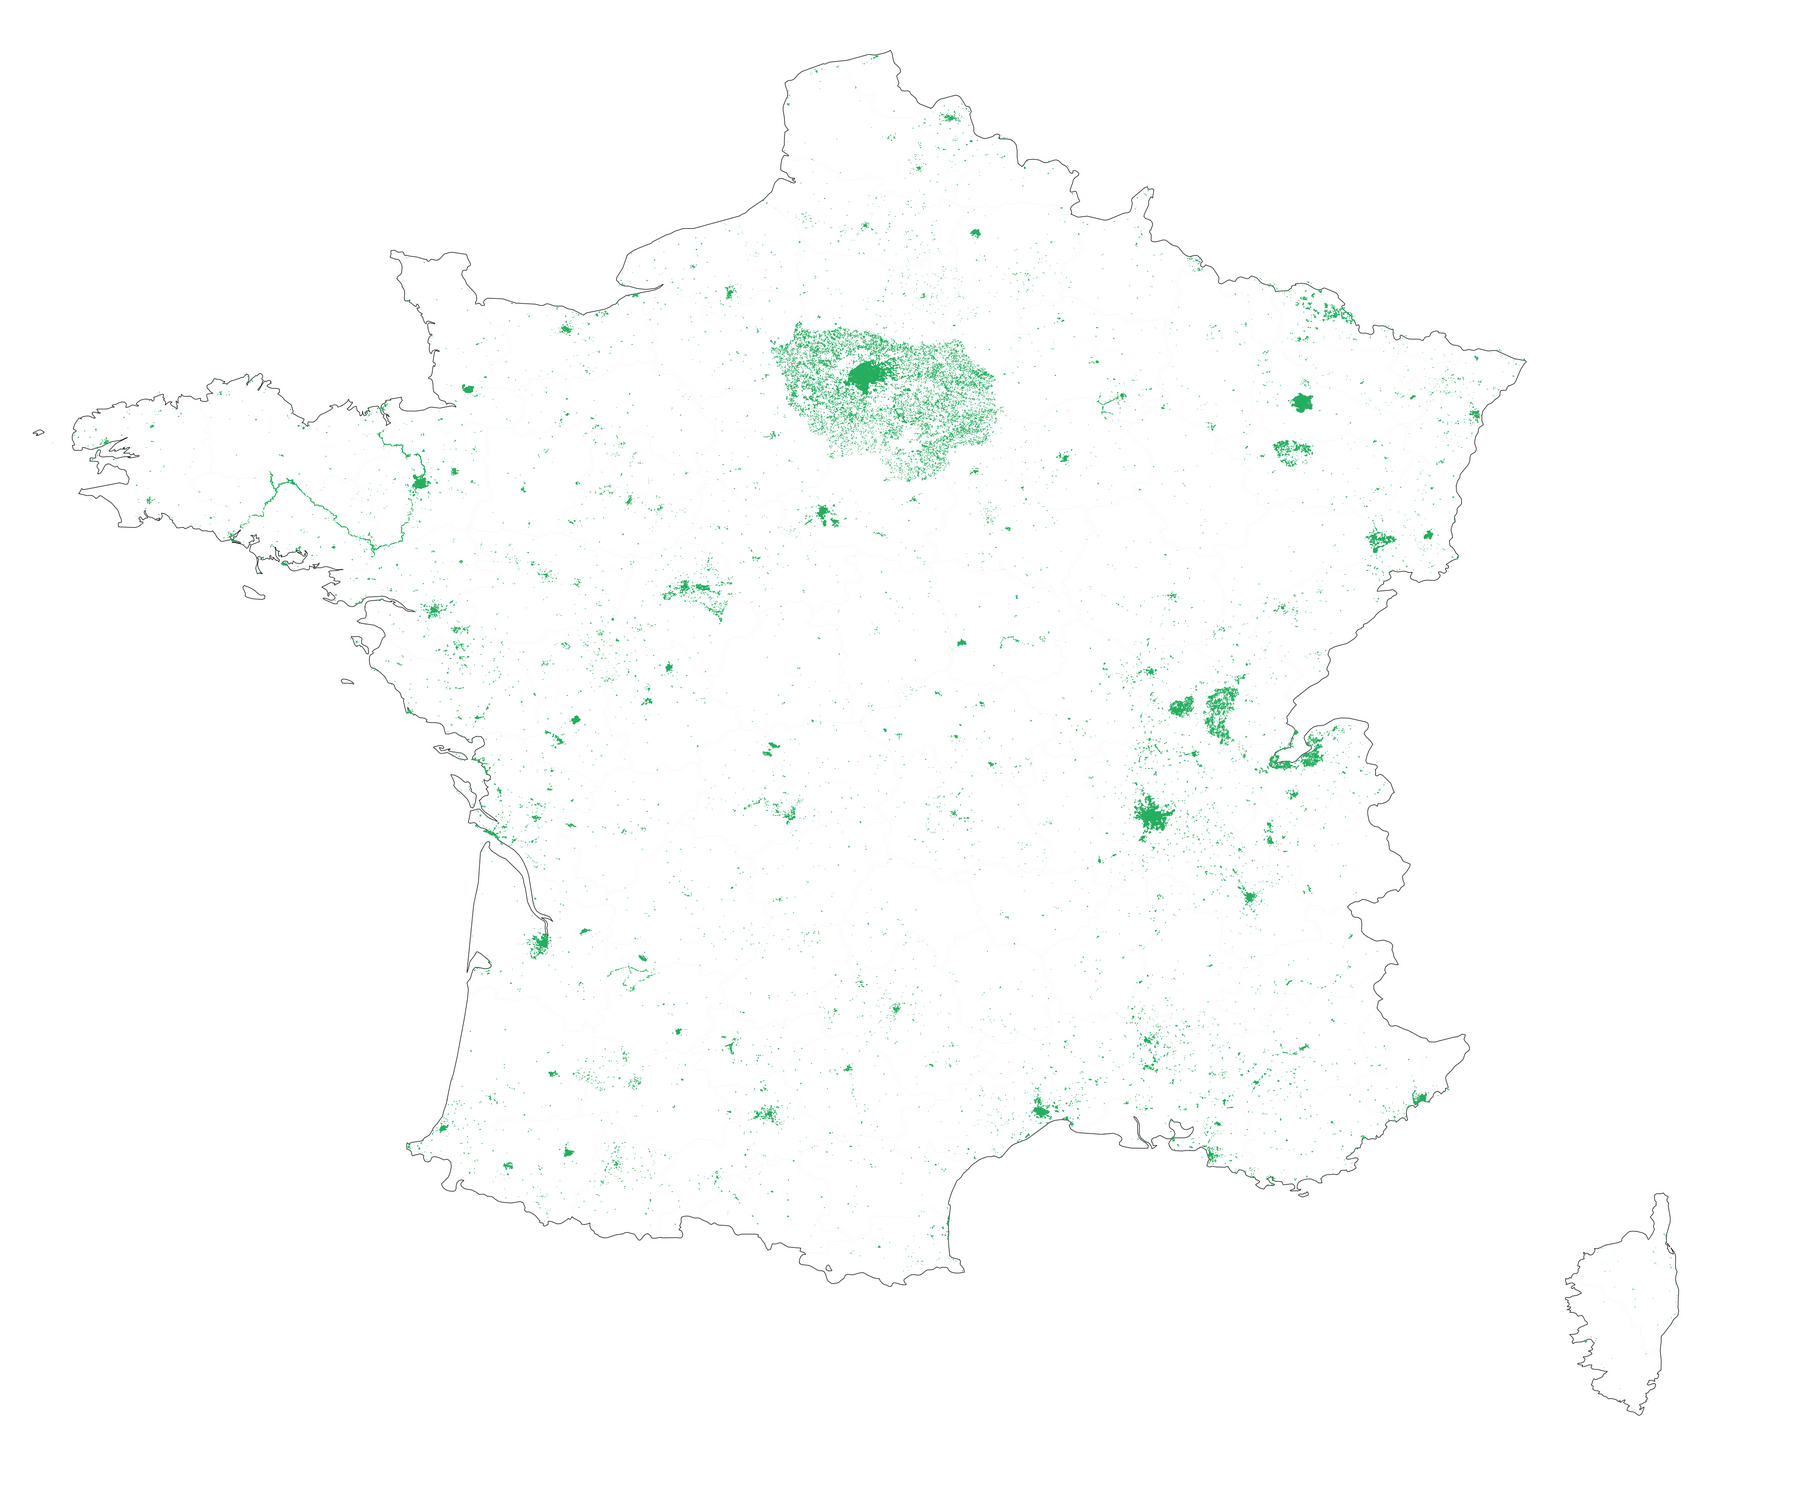
The last visualization I'm showing is actually an image.
There is nothing interactive, and it is my last resort to show data on the web. Our input dataset is more than 700Mo, which makes it really long to load.
That is why I'm using external tools to display it.
Here, I drew the map in QGIS, a powerful open-source software to design maps.
Within the software, I visualize all the classified trees in France, approximately ~2,000,000, and export it as an image.